- Introduction
- Datasets
- Training and testing
- The HIV case
- Global Score
- Method's details
- Selection of the optimal window
-
CROSS Documentation
Introduction
Knowledge of the secondary structure of an RNA molecule is crucial to study properties such as its functionality, evolutionary conservation and interactions with proteins. Genome-wide techniques to probe RNA secondary structure are becoming available with increasing accuracies. There are numerous approaches including enzyme-based protocols like PARS (Kertesz et al., 2010; Wan et al., 2014), and chemical probing (SHAPE (Watts et al., 2009), icSHAPE (Spitale et al., 2015)), with different scoring systems and applied to different organisms
Recent computational studies (Ouyang et al., 2013; Wu et al., 2015; Lorenz et al., 2016) have shown that including information from PARS and SHAPE data improves the performances of RNA structure prediction algorithms dramatically. Hence predictions on single or double stranded states can broaden the range of applicability of computational approaches and help experimental design.
Here we used data from four different genome-wide studies as well as high-quality structural data from NMR/X-ray experiments to develop the CROSS (computational recognition of secondary structure) algorithm that predicts the secondary structure propensity profile (single and double-stranded state) of an RNA sequence from primary structure information at single nucleotide resolution and without sequence length restrictions.
From each dataset we built an independent model that was tested on data obtained with different techniques and from different organisms. Thus, our approach represents the first computational method for cross-technique comparison of RNA secondary structure propensities.
Datasets
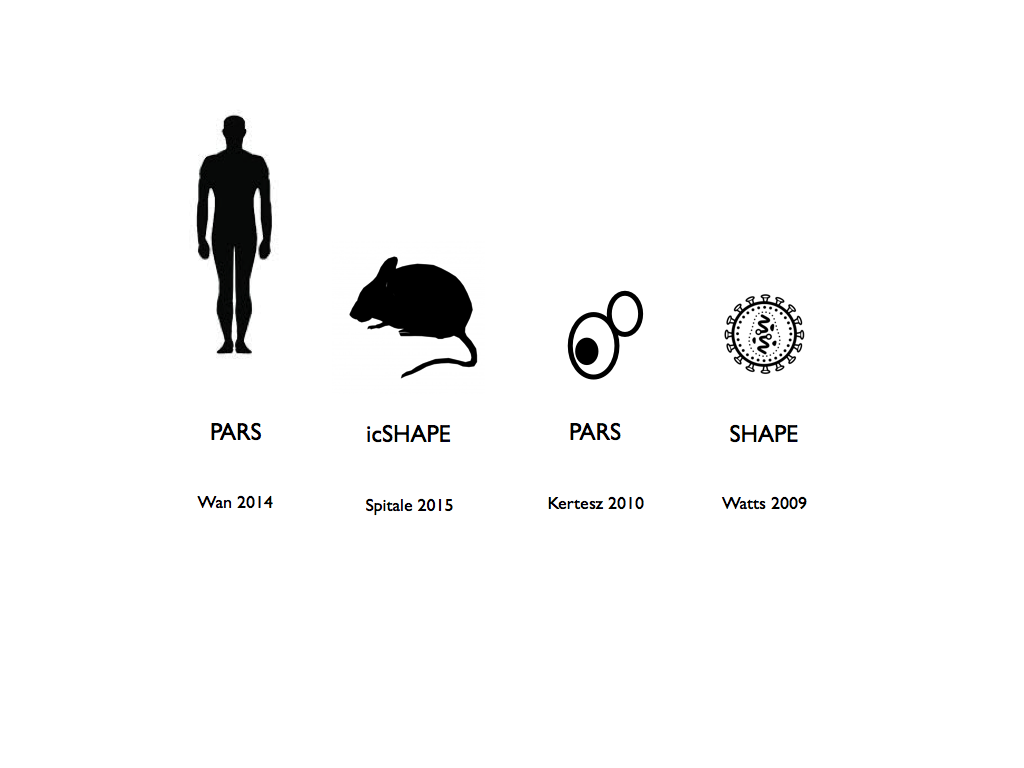
To train CROSS we employed data measured with high-throughput approaches and in different organisms. The SHAPE-HIV model was trained on the complete genome of HIV-1 (9'200 nt) measured with SHAPE (Watts et al., 2009). The highest and lowest reactivity scores from 61'000 M. musculus transcripts were used to build the icSHAPE-Mouse algorithm, (Spitale et al., 2015). The PARS-Yeast model was trained on the structural profiles of 3'200 S. cerevisiae transcripts probed with the PARS protocol (Kertesz et al., 2010). As for the PARS-Human (Wan et al., 2014) algorithm, H. sapiens data were kindly provided by Dr. H. Chang and we could match about 25'000 sequences with the NCBI database. Structures experimentally validated with NMR or X-ray were downloaded from the RNAstrand website (Andronescu et al., 2008). We used the subset “PDB” containing 1'059 sequences and we reduced sequence similarity to 75% using CD-HIT (Li et al., 2006).
Training and testing
On each dataset (i.e. PARS-Human, PARS-Yeast, SHAPE-HIV, icSHAPE-Mouse and multiple-organism structural data from NMR/X-ray) a model was trained and then tested against the other sets. A description of the algorithm used for training can be found in the section Method’s details.
In the training phase, the number of single- and double-stranded regions was balanced and a 13-nucleotide window (or fragment) was employed to extract information on the sequence context of the central nucleotide (see Selection of the optimal window). In the testing phase, the same 13-nucleotides window was applied to scan the input sequences.
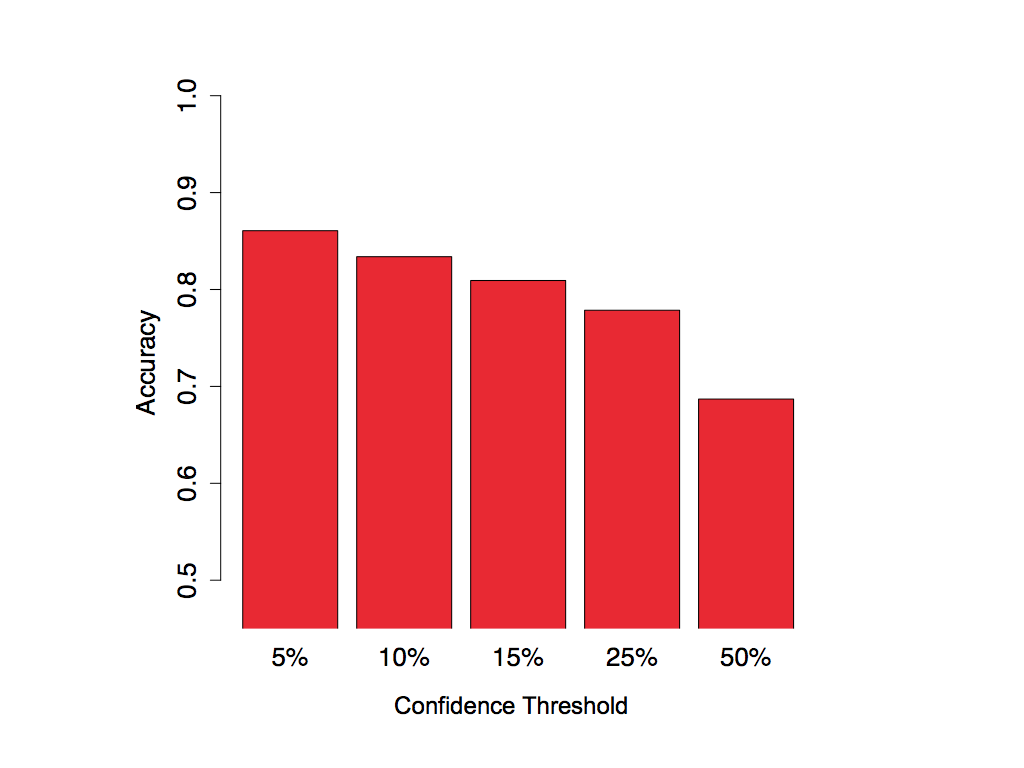
From the CROSS predictions on the test sets we extracted from all the nucleotides the x percent with the highest scores and the x percent with the lowest scores (see Method's details) and compared the predicted secondary structure propensities with the experimental data. In the bar plot below we show the performance of the model trained on PARS-Human applied to the SHAPE-HIV dataset for different values of the confidence threshold x.
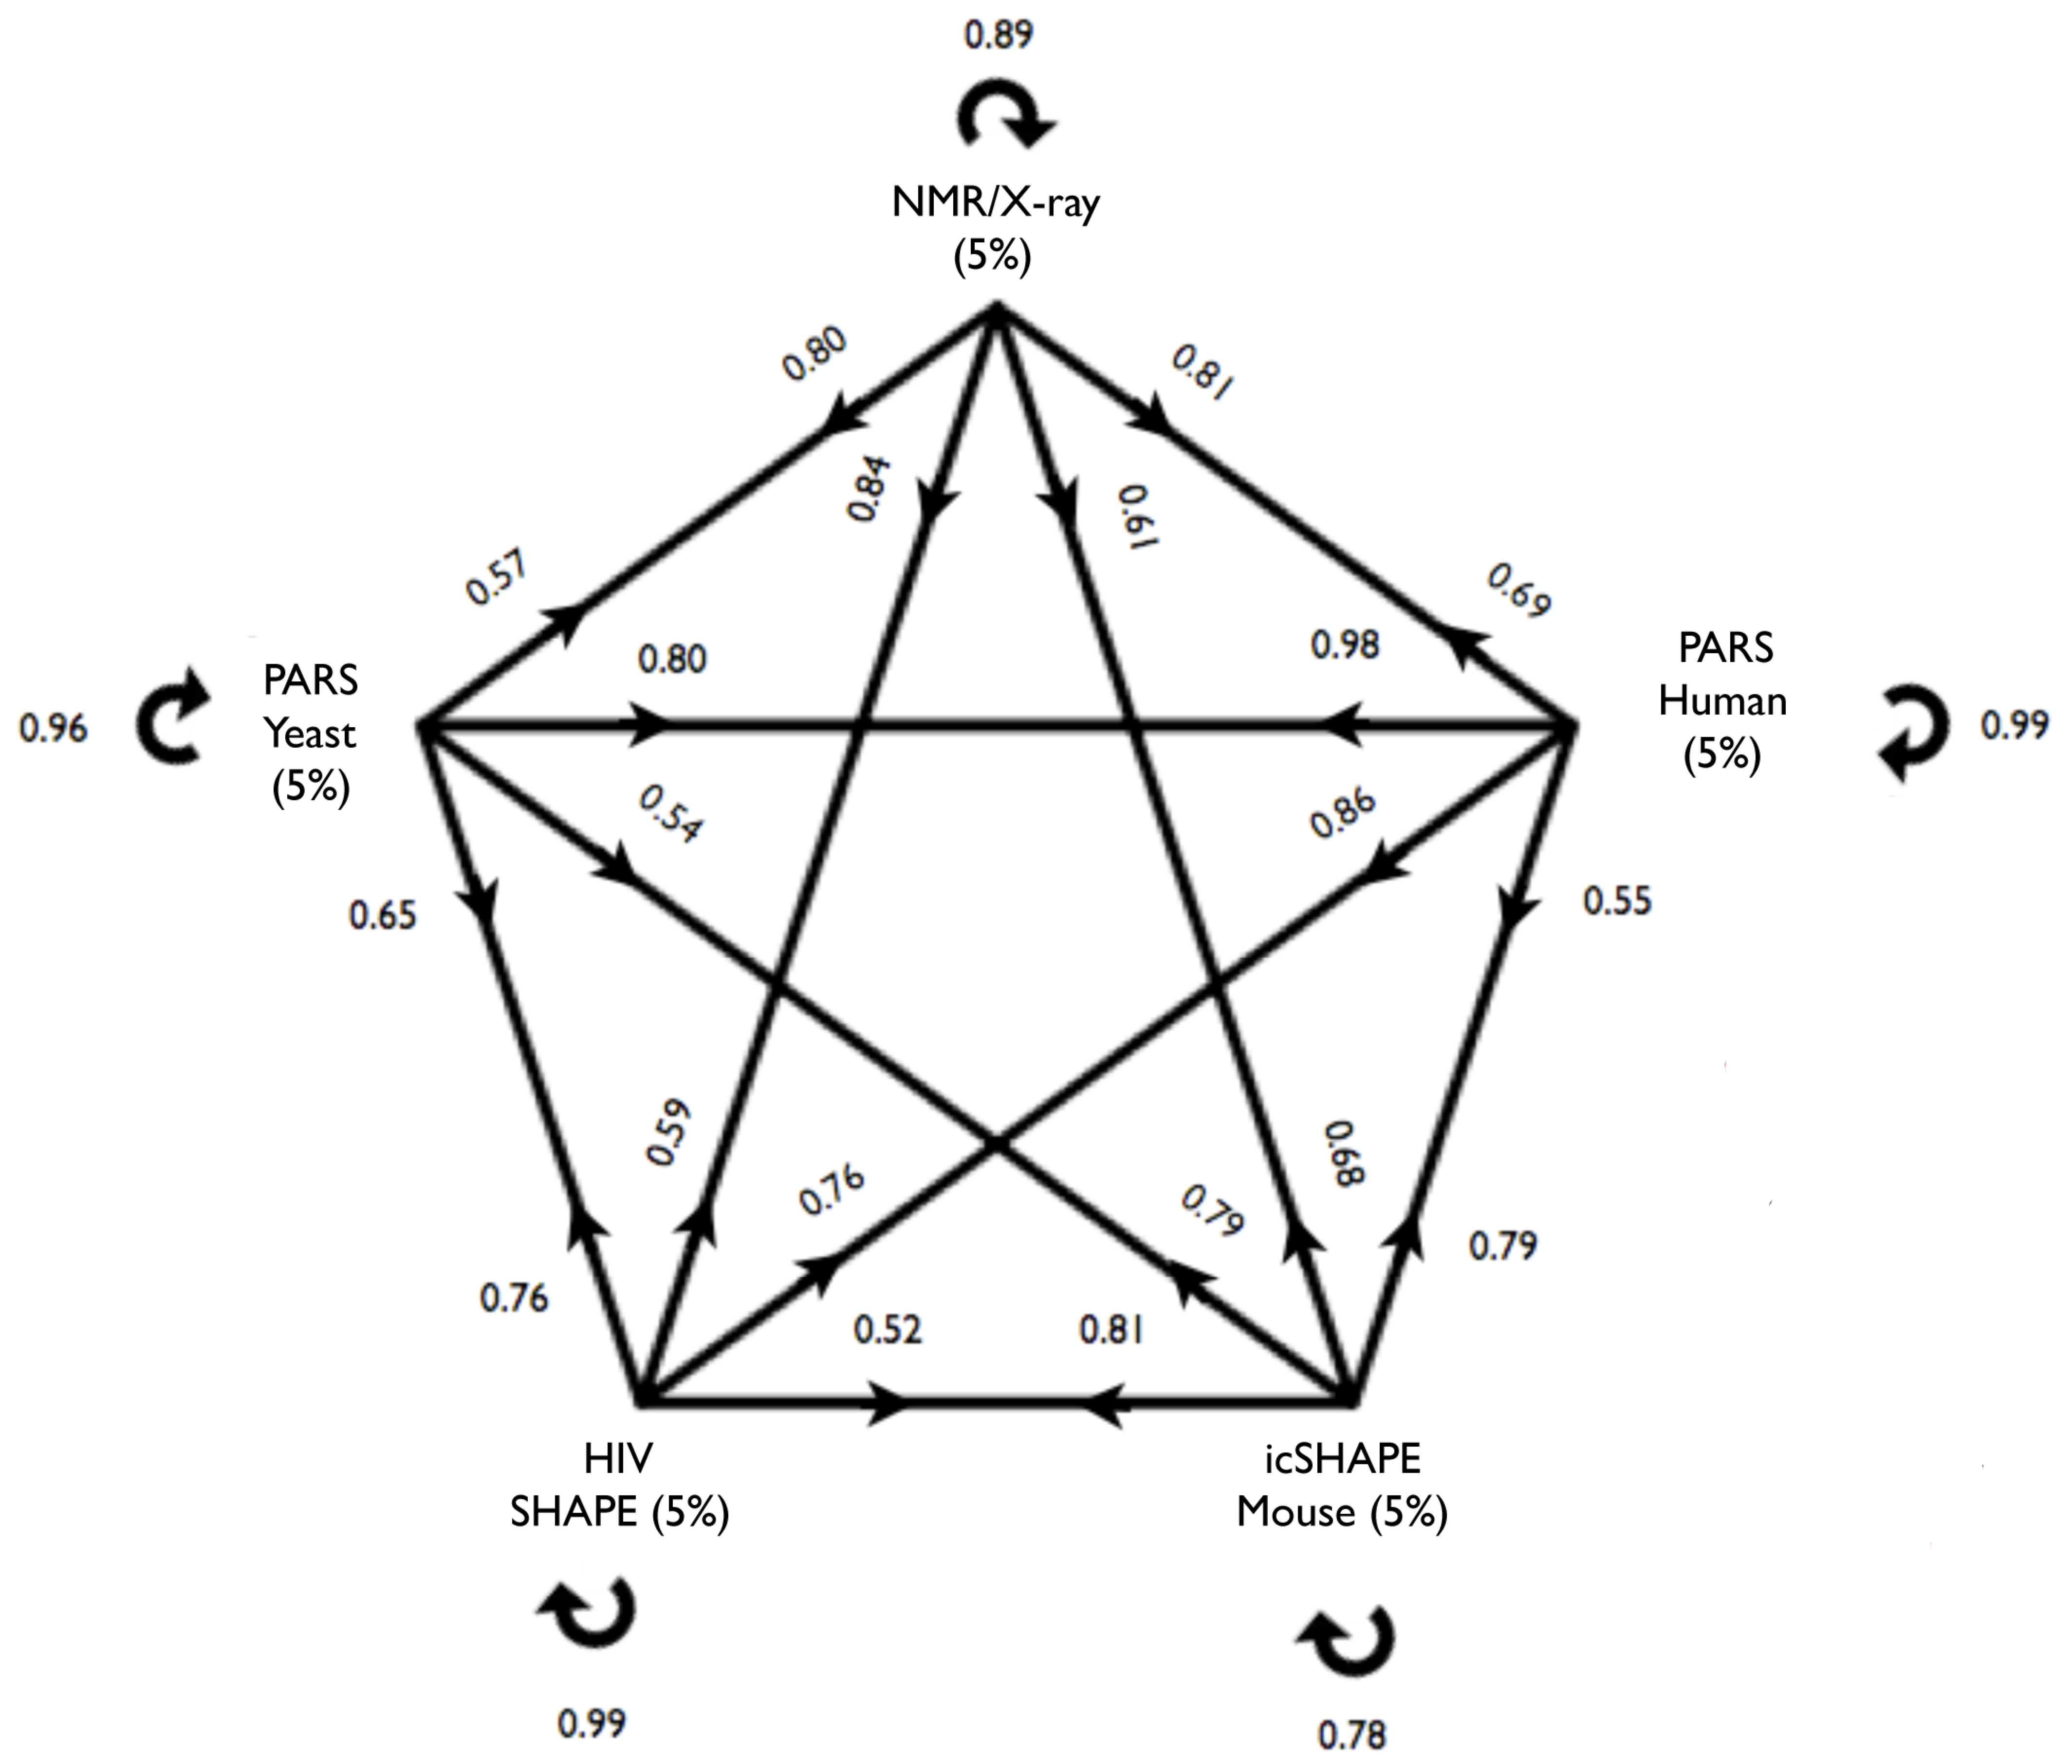
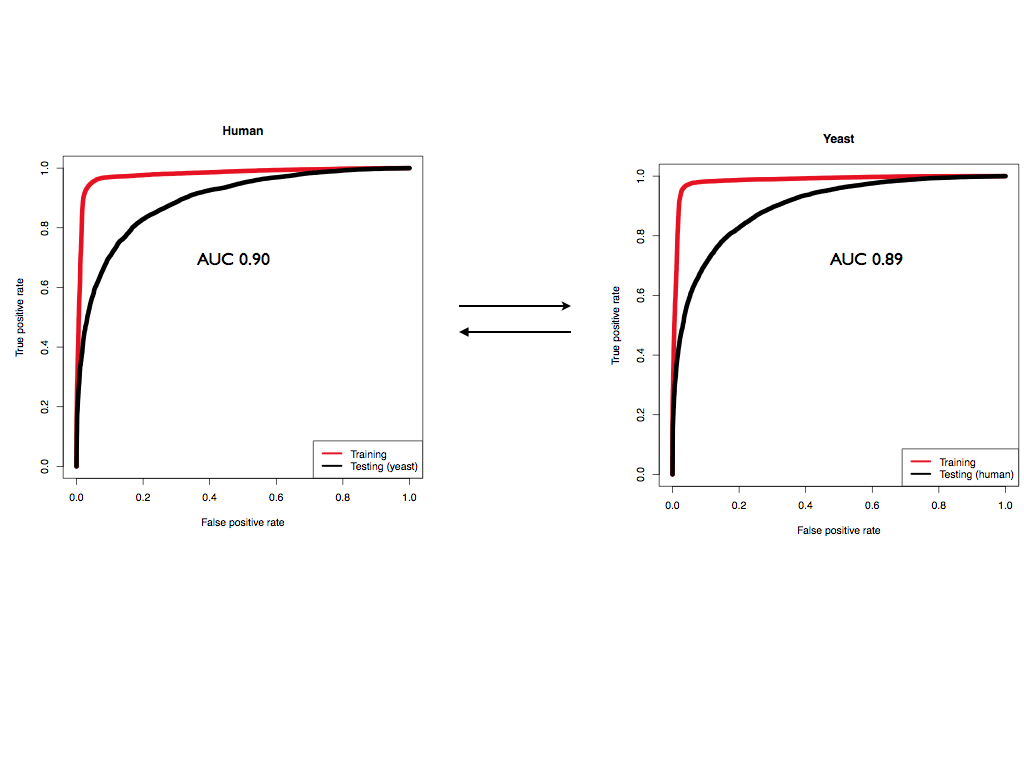
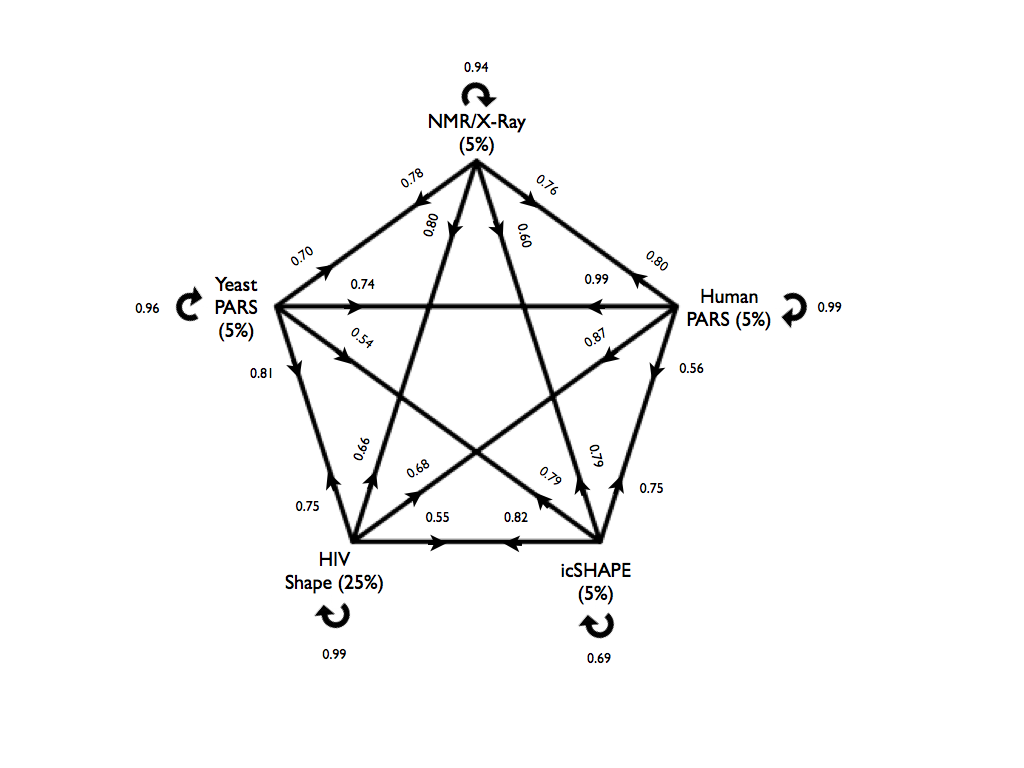
 The cross-validation results for all models are presented in the figure below. Here we chose a confidence threshold of x = 5% for PARS-Human, PARS-Yeast, icSHAPE-Mouse and NMR/X-ray, and x = 25% for SHAPE-HIV due to the smaller size of the data set. On each arrow we report the accuracy of a model tested on the other datasets. For example, a model trained on PARS-Human predicts SHAPE-HIV data with an accuracy of 0.86 where the performances were evaluated on an equal number of top- and bottom-ranked cases, each consisting of 5% of the total HIV transcriptome.
 Figures showing other performance measures can be found here: TPR (true positive rate) and PPV (positive predictive value).
All the models were also validated on all the complete datasets, i.e. with x = 50%, and we computed the global area under the ROC curve (AUC) for each test. The results are shown in the table below. The training models are specified in the columns, while the testing sets are in the rows. Performances during the training phase are shown on the diagonal.
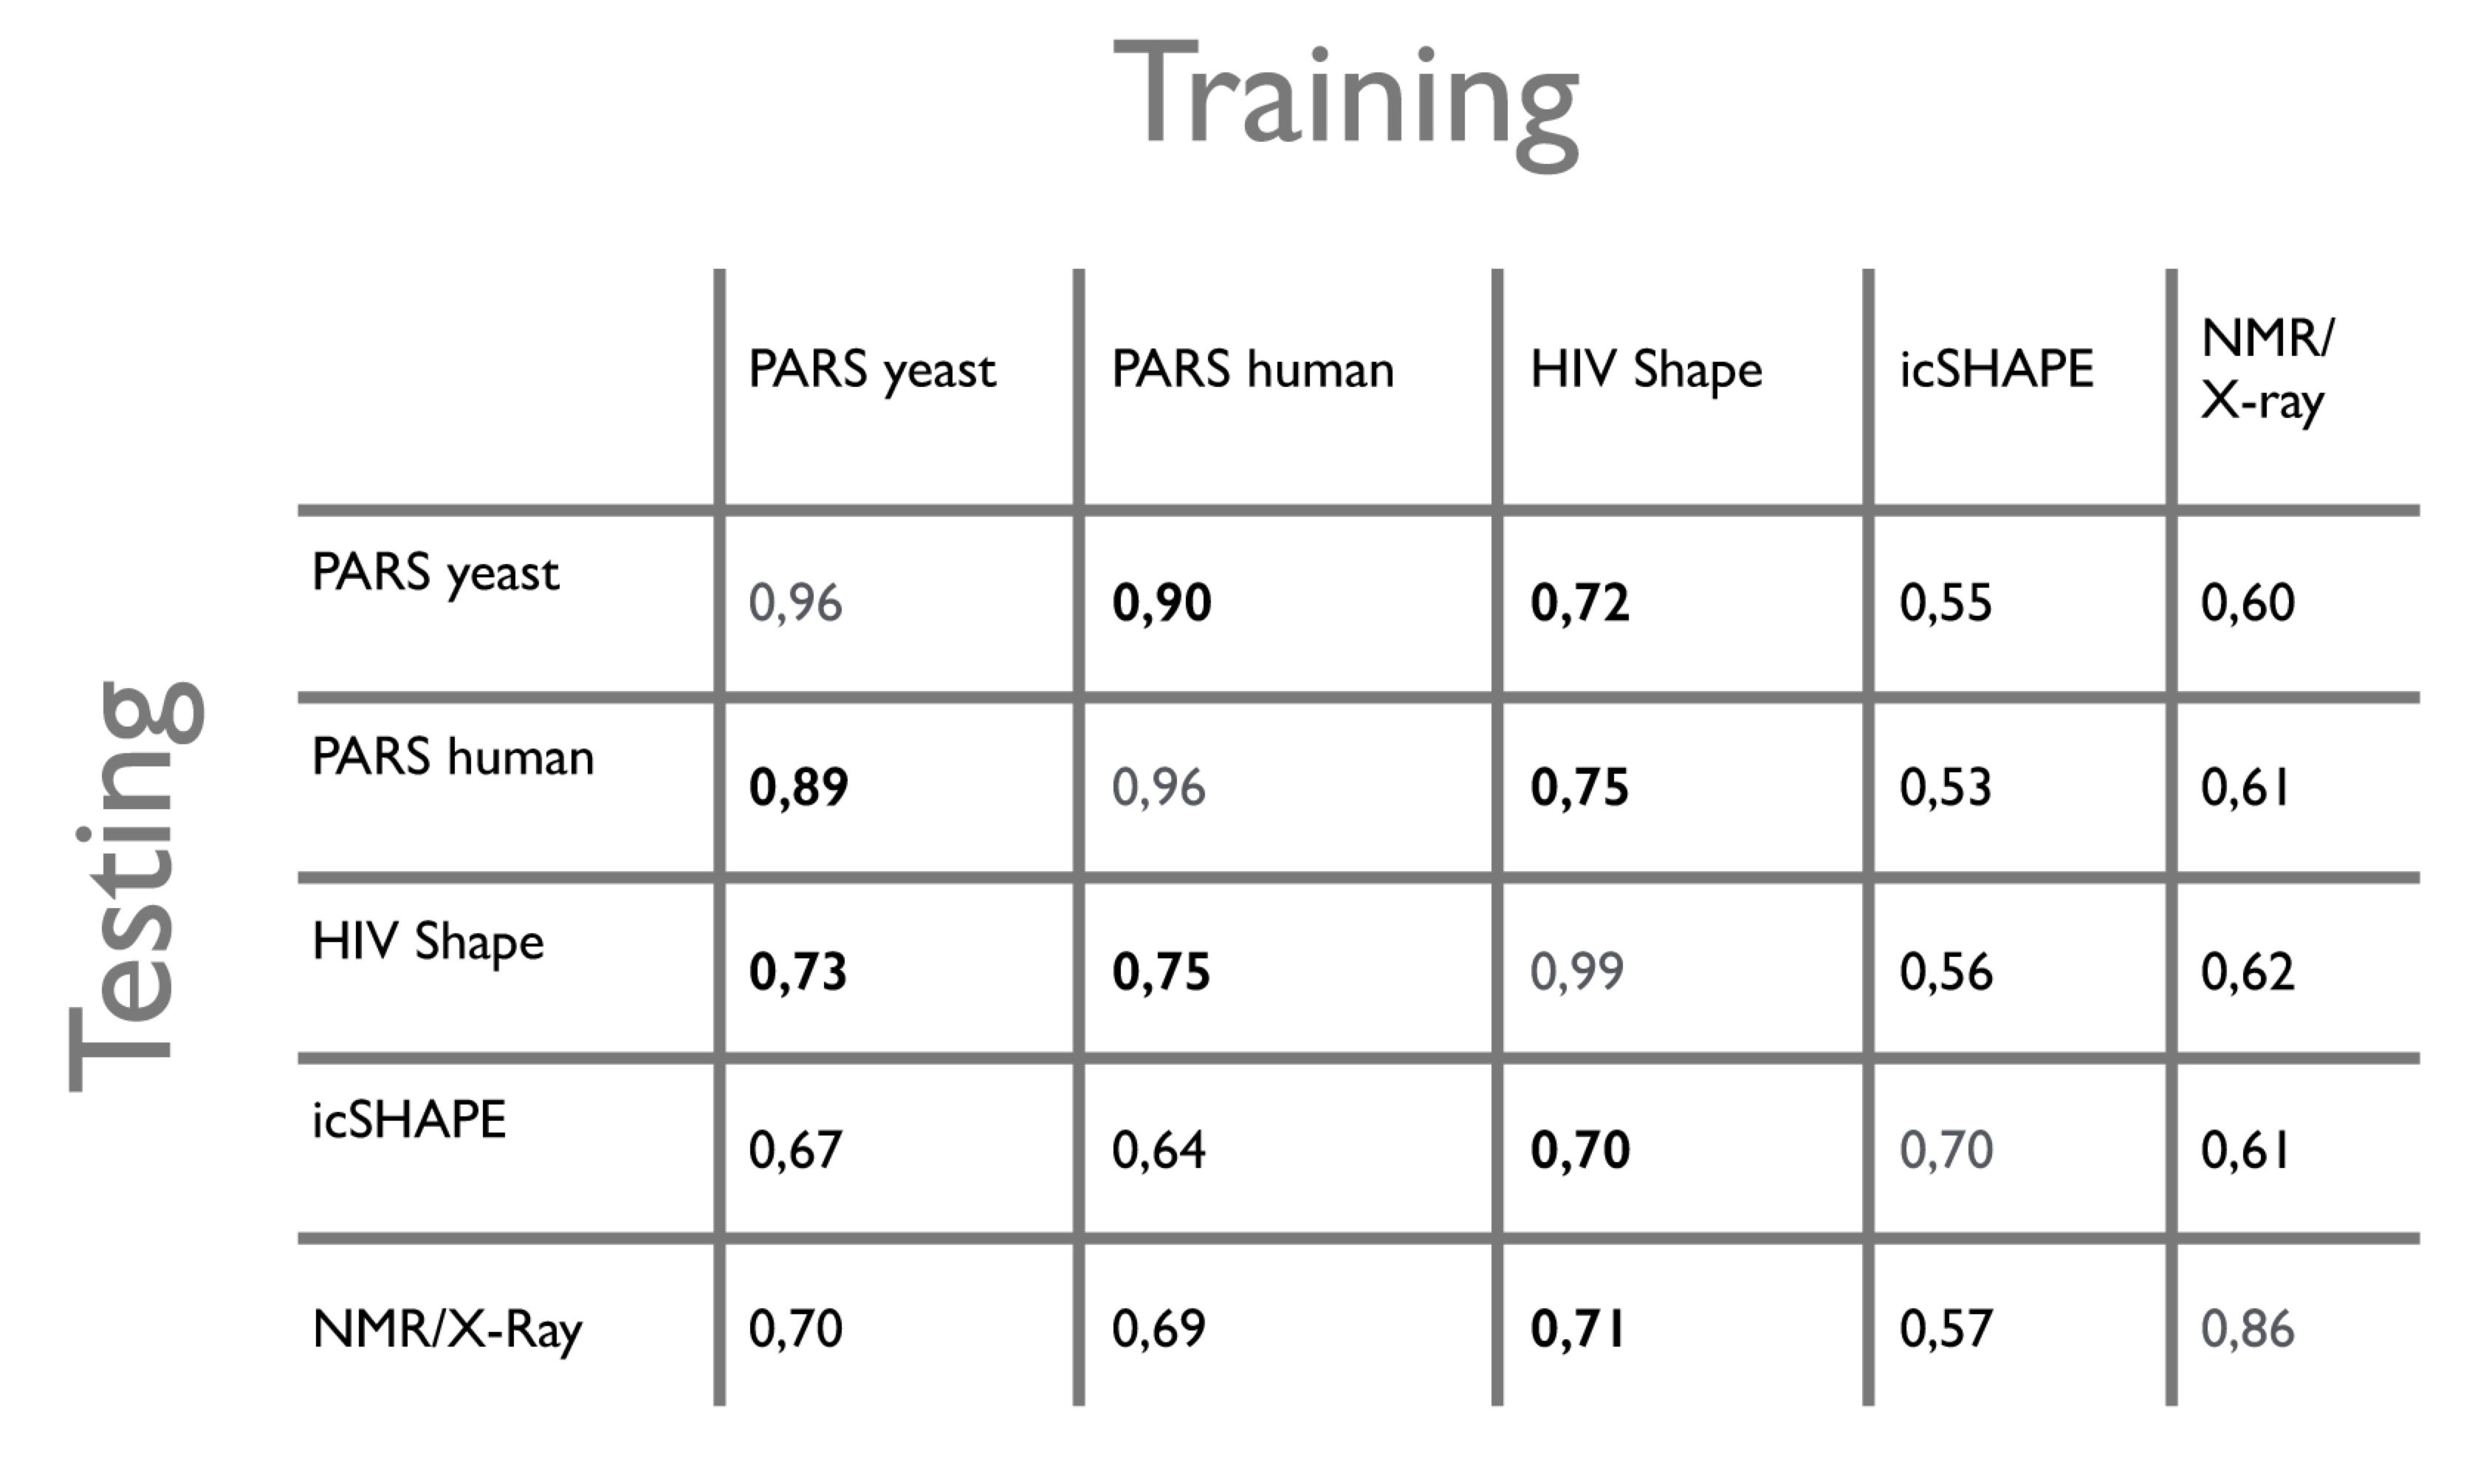
We note that CROSS has comparable performances (AUC ~ 0.89) on the two PARS datasets, even though the experiments were done on different organisms (human and yeast) and with slightly modified protocols, confirming the high quality of our predictions.
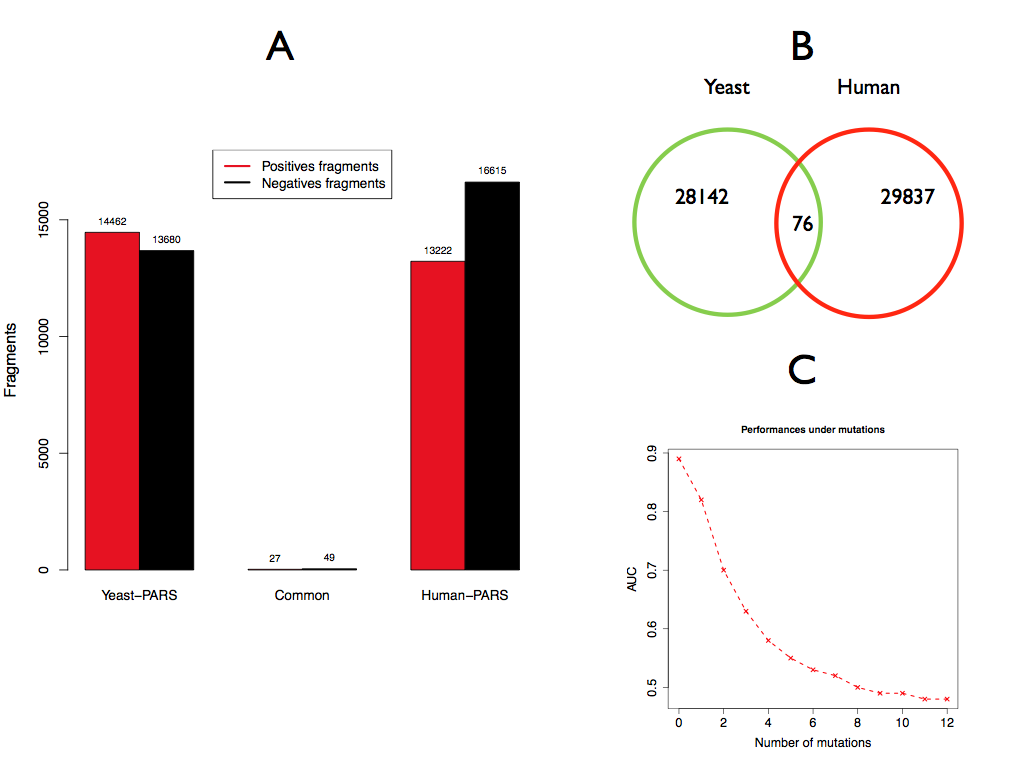
 Importantly there is no overlap between the yeast and human fragment sets (see figure below, panel A and B), which indicates that the algorithms are not biased by particular sequences. We also note that our models are sensitive to single point mutations, as the yeast-signal, for instance, drops progressively upon insertion of random mutations in the original sequences (PARS-Human model, Panel C).
The HIV case
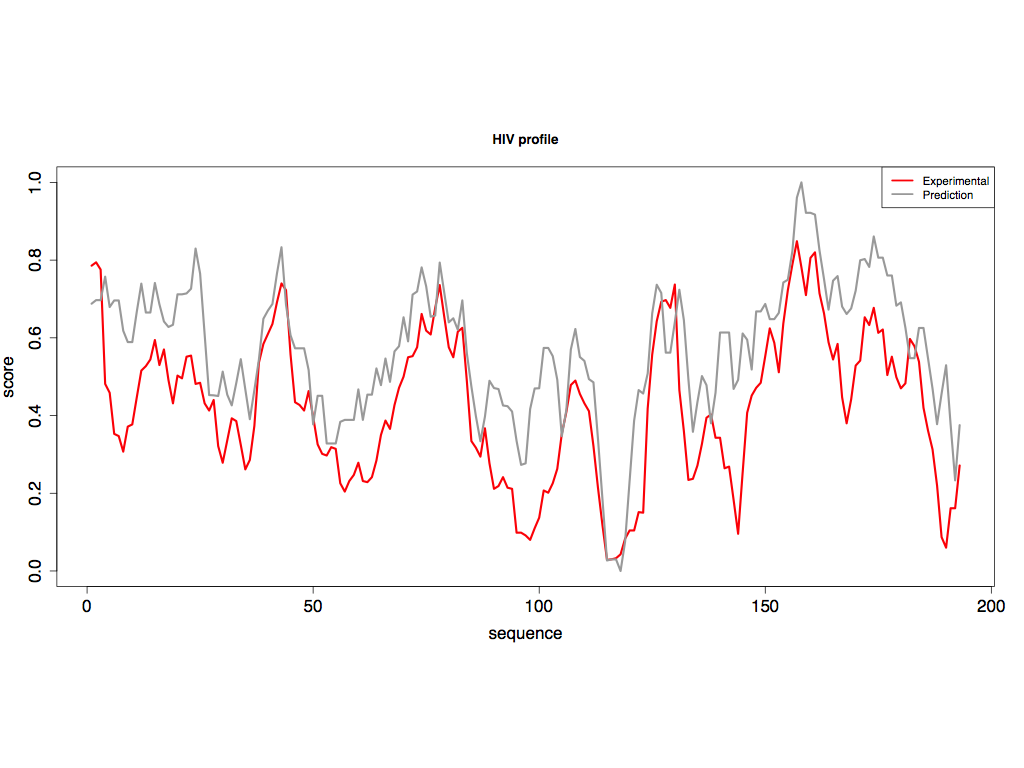
The model built on PARS-Human predicts SHAPE-HIV data with great accuracy. In the figure below we compare experimental and predicted values on a region of 200 nucleotides (region: 3'800-4'000) and report a strong correlation of 0.86 between the two profiles (the average correlation on the HIV transcriptome is 0.60). To better compare with SHAPE output, we linearly normalized the predicitons to lie in the interval [0, 1] with values in (0.5, 1] indicating single-stranded and values in [0, 0.5) indicating double-stranded, and applied a running average with a window size of 7 nucleotides to both profiles.
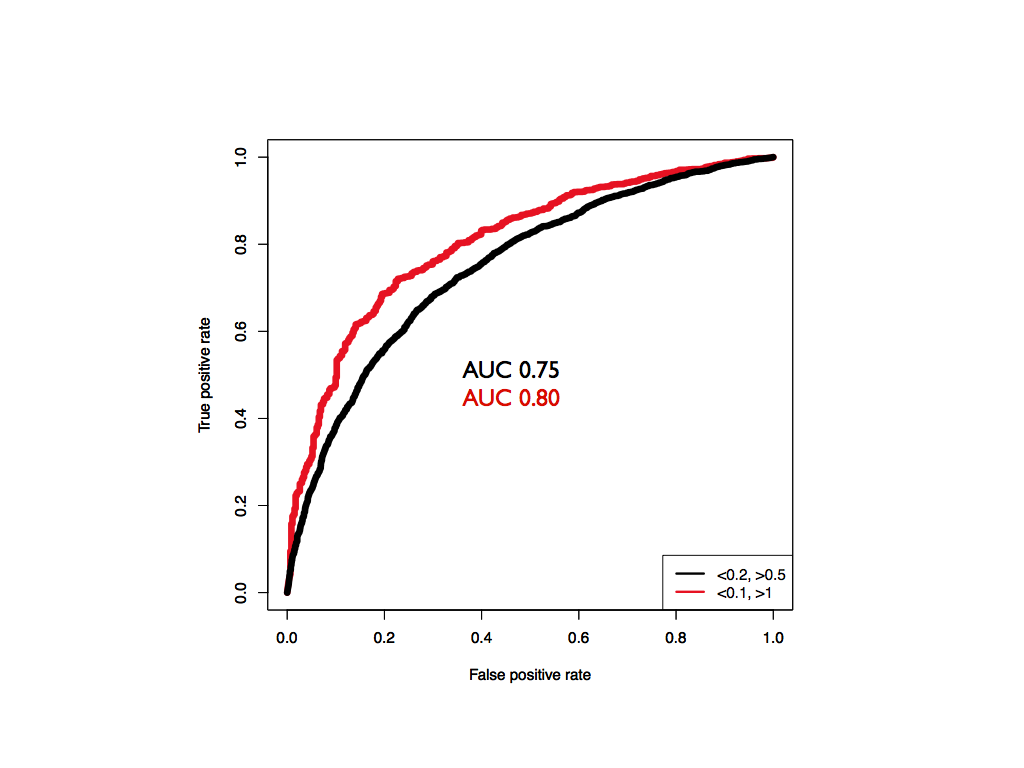
 In addition to a high correlation, the model built on PARS-Human is able to predict SHAPE-HIV data with an overall AUC of 0.75, as shown in the picture below. Increasing the standard thresholds of confidence for SHAPE data (>0.5 for single-stranded, <0.2 for double-stranded) provided by (Watts et al., 2009) to >1 for single-stranded and <0.1 for double stranded increases the performance of CROSS to an AUC of 0.80.
Global Score
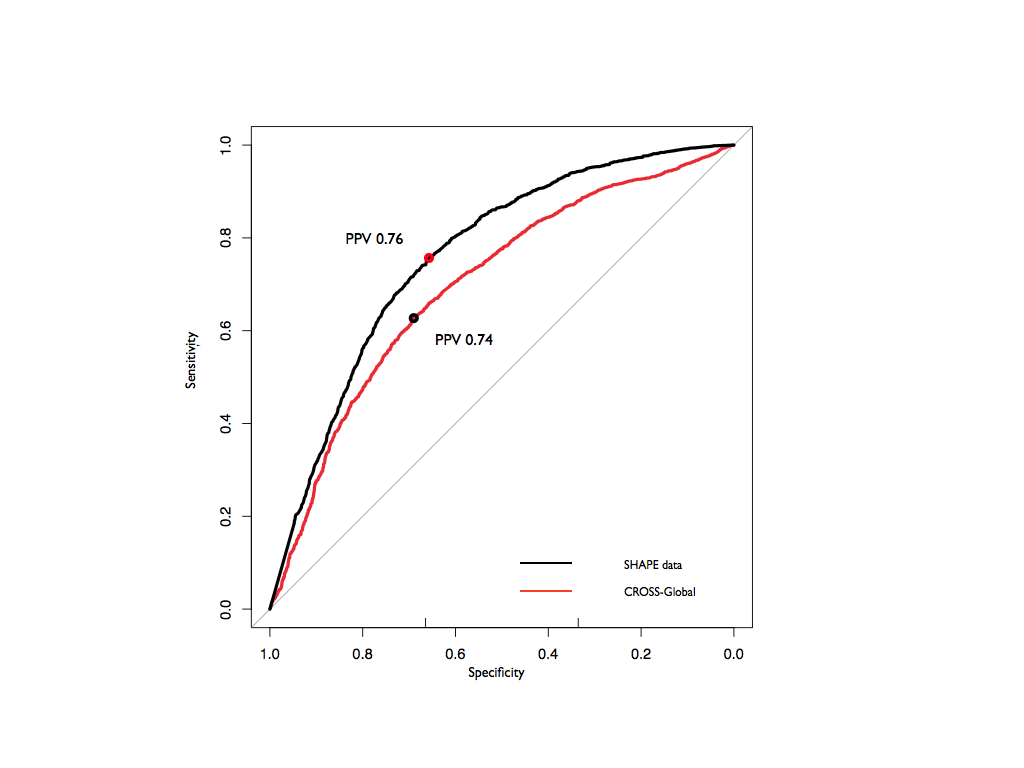
CROSS models are specific for individual experimental approaches. Yet, each technique has practical limitations and a different range of applicability. For this reason, we integrated the five models into a single method, Global Score, to provide a consensus prediction using a next step of machine learning (see Method's details). In the testing phase, single and double-stranded nucleotides were recognized with an AUC of 0.72 and a PPV of 0.74. Comparing the structures with experimental SHAPE data, we observed similar performances (AUC of 0.76 and a PPV of 0.76 on the same dataset).
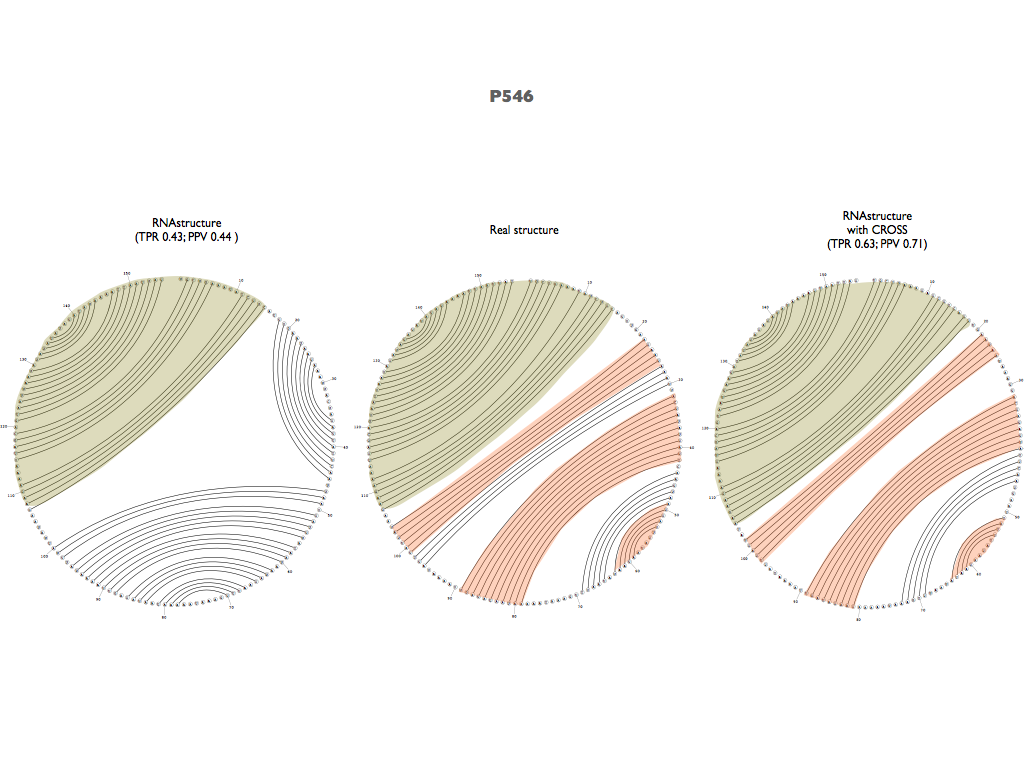
 As previously done with SHAPE data, Global Score was also used as a constraint for RNAstructure (Reuter et al., 2010) predictions. This led to an improvement of PPV (from 0.68 to 0.72) and AUC (from 0.81 to 0.85).
Method's details
The CROSS models were trained using an artificial neural network with one hidden layer and thus two adaptive weight matrices ωik and Ωk which are optimized using backpropagation. We used the FANN (fast artificial neural network) library for the implemention of the network.
In our approach, we use the 4-mer notation to represent each nucleotide: A=[1,0,0,0], C=[0,1,0,0], G=[0,0,1,0] and U=[0,0,0,1]. The input of our algorithm is the vector Fi encoding the information of 13 consecutive nucleotides (see Selection of the optimal window). It thus consists of 13x4 entries.
This input Fi is propagated to the first, hidden layer of k nodes as:
hk = tanh(ωikFi),
where tanh is the hyperbolic tangent of x and the sum follows Einstein notation. The hyperbolic tangent is commonly used in artificial neural network algorithms as it mimics signal processing in biological networks.
The score Π of the nucleotide in the center of the window is then given by:
Π = tanh(Ωkhk),
where the contributions hk of the hidden layer are weighted by Ωk.
The weights ωik and Ωk were optimized using a back-propagation algorithm. To avoid over-fitting when optimizing ωik and Ωk we varied the number of nodes proportionally to the size of the training set and performed a 5-fold cross-validation at each optimization. For k=20 we obtain the performances reported in the figures. We note that the number of weights for k=20 is 1’060 (1’040 entries of ωik, 20 entries of Ωk), i.e. our training sets are large enough to prevent overfitting.
The experimental value corresponding to the central nucleotide is used for the training. In PARS the top 5 and bottom 5 values in each transcript are used for training (yeast: 14'462 positives and 13'680 negatives; human: 13'222 positives and 16'615 negatives; in both sets ambiguous cases, i.e. zero values, have been removed).
For SHAPE we use unambiguous values (>0.5 for single-stranded, <0.2 for double-stranded) provided by (Watts et al., 2009), and for icSHAPE we use the highest and lowest propensity values (1 for single-stranded, 0 for double-stranded, a total of 556'645 positives and 355'740 negatives).
As for NMR/X-ray data, we used 15'134 positives and 15'009 negatives. In all cases, the number of single- and double-stranded regions was balanced using the less populated class.
To provide a consensus prediction from these five models, we developed the model Global Score. We used the scores of the five classifiers as input for a support vector machine (SVM) with radial basis function (RBF) kernel. The output of this artificial neural network is a propensity score in the range [-1, 1]. To train the model, we used 43 sequences (11’670 fragments) with available structure data (Ding et al., 2009). The test set was composed of 24 transcripts (5’475 fragments) that were not in the training set of any of the CROSS models (Lorenz et al., 2009). Global Score was developed with the application as a constraint for RNA folding algorithms based on thermodynamic principles in mind.
Selection of the optimal window
To extract information from primary structure we used different window sizes around each nucleotide associated to PARS or icSHAPE signal. A previous study on enzyme V1 used in PARS (Lowman et al., 1986) indicated that the protein needs at least 6 nucleotides around the cutting point.
• A window of 7 nucleotides centered on the value of interest (3+1+3 nt) is too small to capture the information. Indeed, by sampling 10000 fragments of length 7, only 22 can be unambiguously matched (i.e., assigned to either single or double stranded class) with a frequency > 90%.
• Instead, by using a window of 13 nucleotides, which is twice the size of the minimal fragment for PARS-yeast (6+1+6 nt), 28142 out of 30349 fragments were unambiguously matched to either single or double stranded regions.
• By doubling the window size to 25 (12+1+12) nucleotides only a slight increment of unique fragments (30132) can be observed. We stress that a large window, such as for instance 25 nucleotides, reduces the number of nucleotides that can be studied at the 5’ and 3’ of each sequence, which reduces the applicability of the method to short sequences (around 50 nt).
• The performance increase when using larger windows (13, 25, 37 nucleotides) in a ten-fold cross-validation on yeast transcriptome is very moderate with AUCs of 0.92 (13 nt), 0.93 (25 nt) and 0.94 (37 nt), respectively.
Thus we consider a window of 13 nucleotides to be optimal to capture signal without losing information. We note that the minimum window size capturing the combinatorial complexity of PARS signals on the human transcriptome is indeed 13 nucleotides (i.e., 67 millions of values ~413), which is compatible with the information coming from icSHAPE data (12 millions of values).
References:
Kertesz et al. Genome-wide measurement of RNA secondary structure in yeast. Nature. 2010 Sep 2;467(7311):103-7. doi: 10.1038/nature09322
Wan Y et al. Landscape and variation of RNA secondary structure across the human transcriptome. Nature. 2014 Jan 30;505(7485):706-9. doi:10.1038/nature12946
Andronescu et al. RNA STRAND: the RNA secondary structure and statistical analysis database. BMC Bioinformatics. 2008 Aug 13;9:340. doi: 10.1186/1471-2105-9-340
Watts et al. Architecture and secondary structure of an entire HIV-1 RNA genome. Nature. 2009 Aug 6;460(7256):711-6. doi: 10.1038/nature08237
Spitale et al. Structural imprints in vivo decode RNA regulatory mechanisms. Nature. 2015 Mar 26;519(7544):486-90. doi:10.1038/nature14263
Li et al. Cd-hit: a fast program for clustering and comparing large sets of protein or nucleotide sequences. Bioinformatics 2006; 22(13):1658-9
Ouyang Z et al. SeqFold: genome-scale reconstruction of RNA secondary structure integrating high-throughput sequencing data. Genome Res. 2013 Feb;23(2):377-87. doi: 10.1101/gr.138545.112.
Lorentz et al. SHAPE directed RNA folding. Bioinformatics. 2016 Jan 1;32(1):145-7. doi: 10.1093/bioinformatics/btv523.
Lowman et al. On the recognition of helical RNA by cobra venom V1 nuclease. J Biol Chem. 1986 Apr 25;261(12):5396-403.
Wu Y et al. Improved prediction of RNA secondary structure by integrating the free energy model with restraints derived from experimental probing data. Nucleic Acids Res. 2015 Sep 3;43(15):7247-59. doi: 10.1093/nar/gkv706. Epub 2015 Jul 13.
Reuter et al. RNAstructure: software for RNA secondary structure prediction and analysis. BMC bioinformatics. 2010. doi:10.1186/1471-2105-11-129