- Introduction
- Validation of the methodology
- Structural conservation of lncRNAs: Xist
- Structural conservation of lncRNAs: HOTAIR
- Viruses
- DTW
- CROSS algorithm
- p-values
-
CROSSalign Documentation
Introduction
CROSSalign is based on the combination of two algorithm: 1) CROSS (computational recognition of secondary structure) an algorithm to predict the RNA secondary structure trained on experimental data, without any sequence length restriction and at single-nucleotide resolution 2) a DTW (Dynamic Time Warping) algorithm to align and assess the similarity of two profiles of different lengths (see DTW).
Validation of the methodology
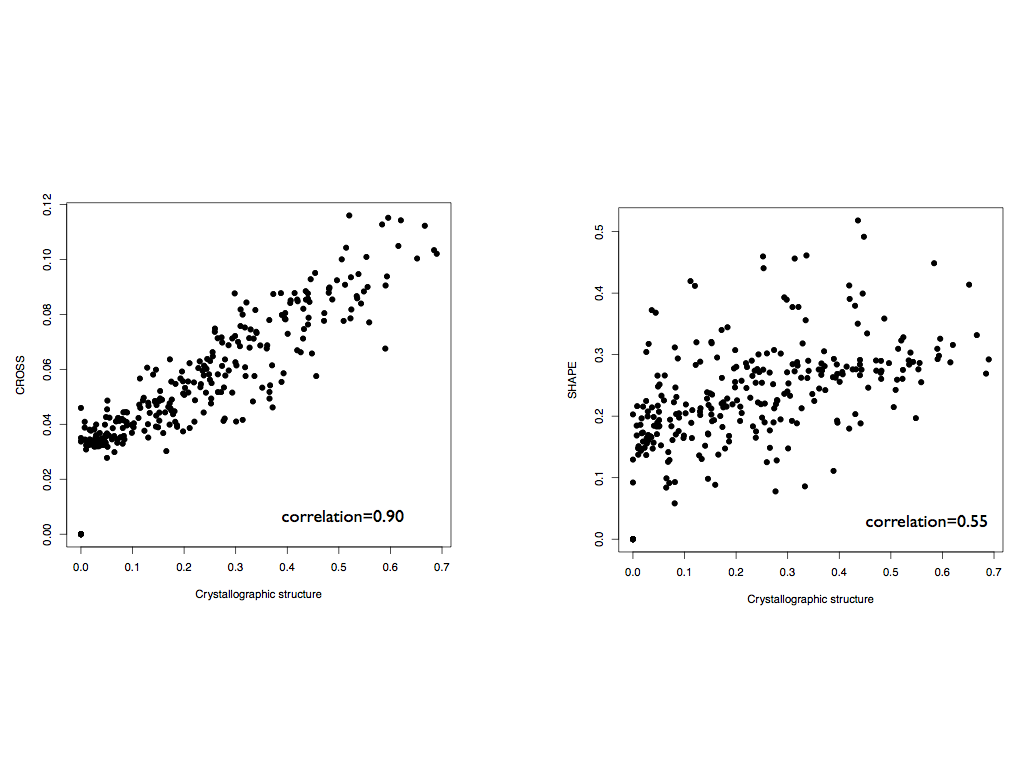
To test the performances and functionality of a predictive algorithm (CROSS) combined with a DTW algorithm, we selected a dataset of 22 structures with both SHAPE data and the crystallographic structures available (Lorentz et al., 2016). Using CROSSalign, we compared the structural distances between all possible couples in the dataset, using: 1) the crystallographic profiles (dots and brackets become 0 and 1), 2) SHAPE data, and 3) CROSS predictions. CROSS not only shows a high correlation with the crystallographic data (correlation 0.90) but also a better correlation than SHAPE. These results validate CROSS a valid alternative to real crystals inside a DTW algorithm.
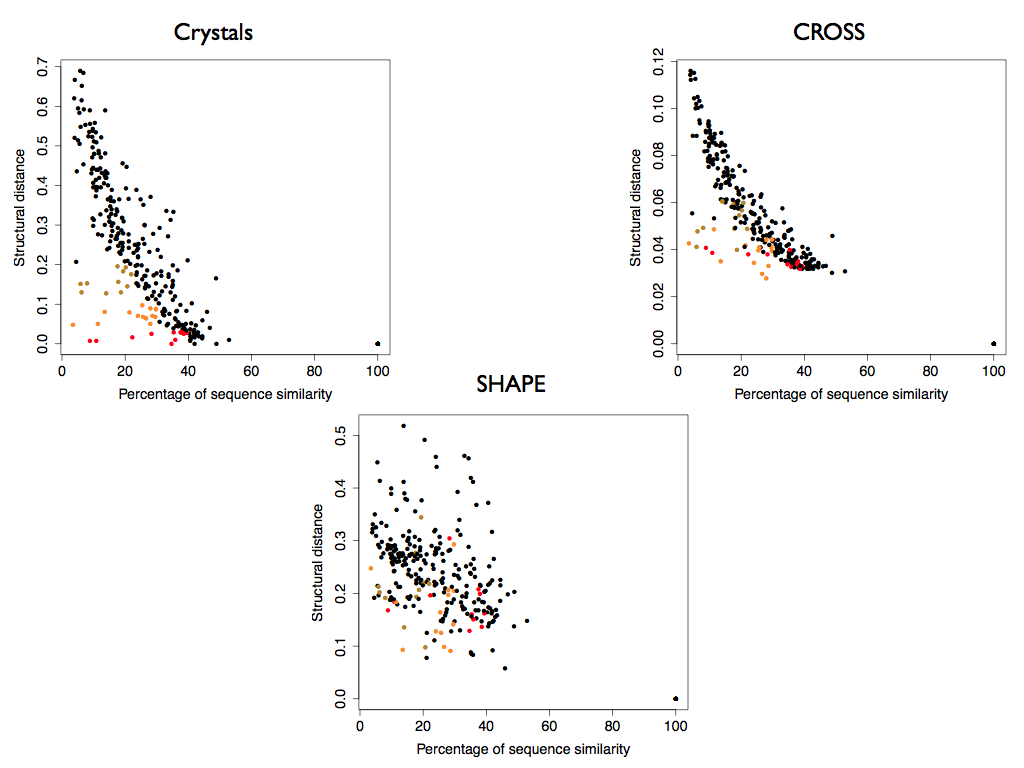
 Moreover, the correlation between the structural distance from the crystals and the similarity of the primary sequence is 0.57, higher enough to show an important contribution from the sequence similarity in order to explain secondary structure similarity, but not enough to associate sequence identity with structural identity.
Crystallographic data and CROSS profiles allow the identification of specific clusters of RNA molecules with low sequence similarity and high structural similarity (colored in red, orange and green).
Interestingly, SHAPE data combined with DTW are not able to identify these clusters and the structures contained.
Moreover, the correlation between the structural distance from the crystals and the similarity of the primary sequence is 0.57, higher enough to show an important contribution from the sequence similarity in order to explain secondary structure similarity, but not enough to associate sequence identity with structural identity.
Crystallographic data and CROSS profiles allow the identification of specific clusters of RNA molecules with low sequence similarity and high structural similarity (colored in red, orange and green).
Interestingly, SHAPE data combined with DTW are not able to identify these clusters and the structures contained.
Structural conservation of lncRNAs: Xist
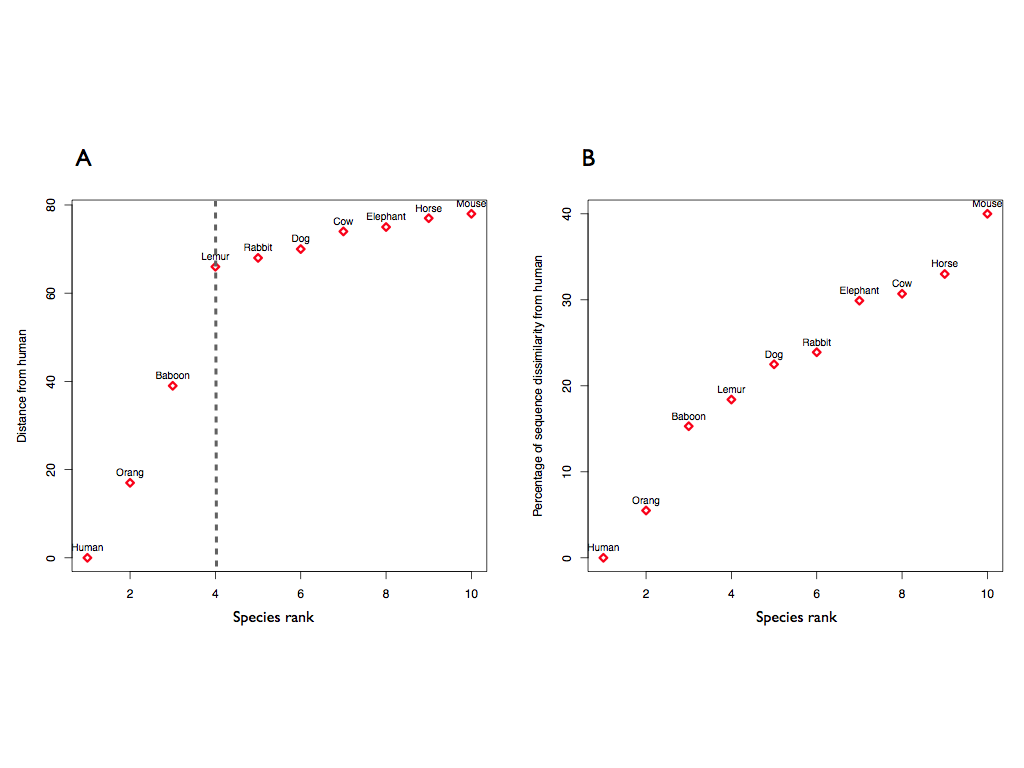
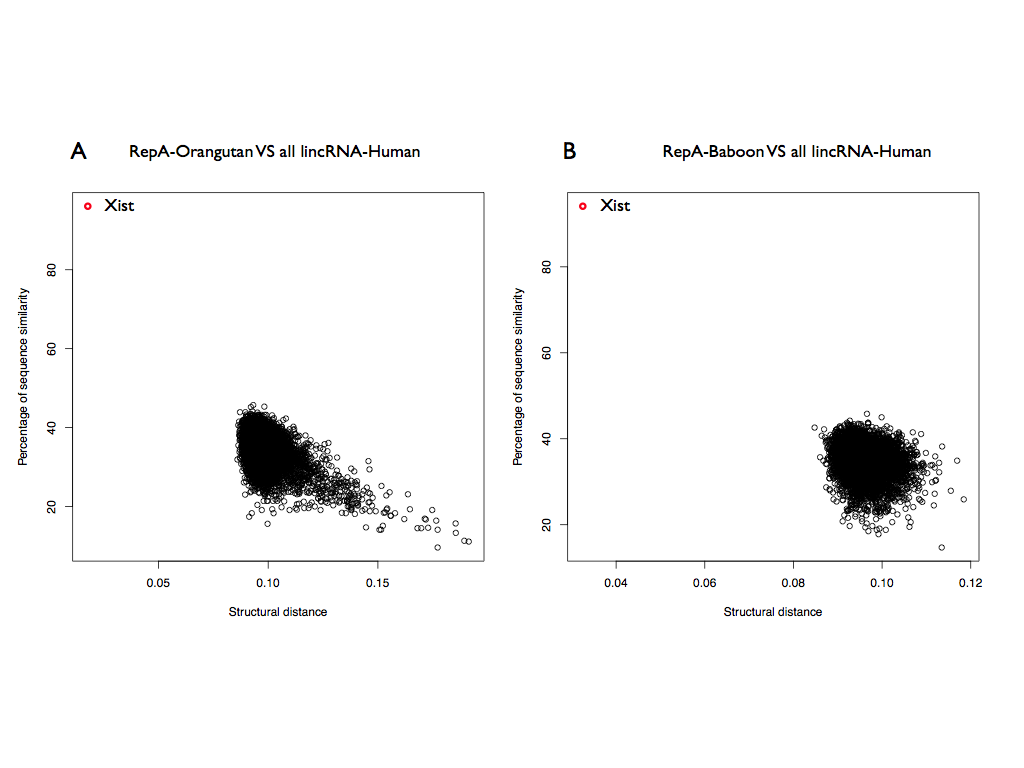
We used CROSSalign to study the structural similarities of the RepA of Xist in 10 different species (Maenner et al., 2010). Observing how different is the RepA of each species from the RepA-Human, we can see that the primates tend to cluster closer to human (A; structural distance x100), as expected, while the other species show a similar, farther structural distance. A similar result can be observed building the distance from human using the percentage of sequence dissimilarity (B; 100-sequence identity %). In this case, however, the RepA of each organism is linearly different from human, without a specific cluster. This analysis suggests that the RepA is conserved in term of secondary structure specifically among the primates, and is more conserved in structure than in sequence.
 To further investigate these results we selected the RepA of Orangutan and we searched the structural similarities in all the human lincRNAs (8176; ENSEMBLE 82). Xist is the best significant match between all the lincRNAs (structural distance 0.01; p-value < 10-6) and also in this case the Rep A is correctly identified (predicted coordinates: 328-764).
This result is further supported for the RepA of Baboon (best result: 0.032) and Lemur (best result: 0.074) against all the human lincRNA, suggesting a structural conservation inside the primates.
To further investigate these results we selected the RepA of Orangutan and we searched the structural similarities in all the human lincRNAs (8176; ENSEMBLE 82). Xist is the best significant match between all the lincRNAs (structural distance 0.01; p-value < 10-6) and also in this case the Rep A is correctly identified (predicted coordinates: 328-764).
This result is further supported for the RepA of Baboon (best result: 0.032) and Lemur (best result: 0.074) against all the human lincRNA, suggesting a structural conservation inside the primates.
 The Rep A of mouse and human are farther both in terms of structural distance and sequence similarity. Previous studies already showed the complexity of the structural homology between human and mouse (Breschi et al., 2017).
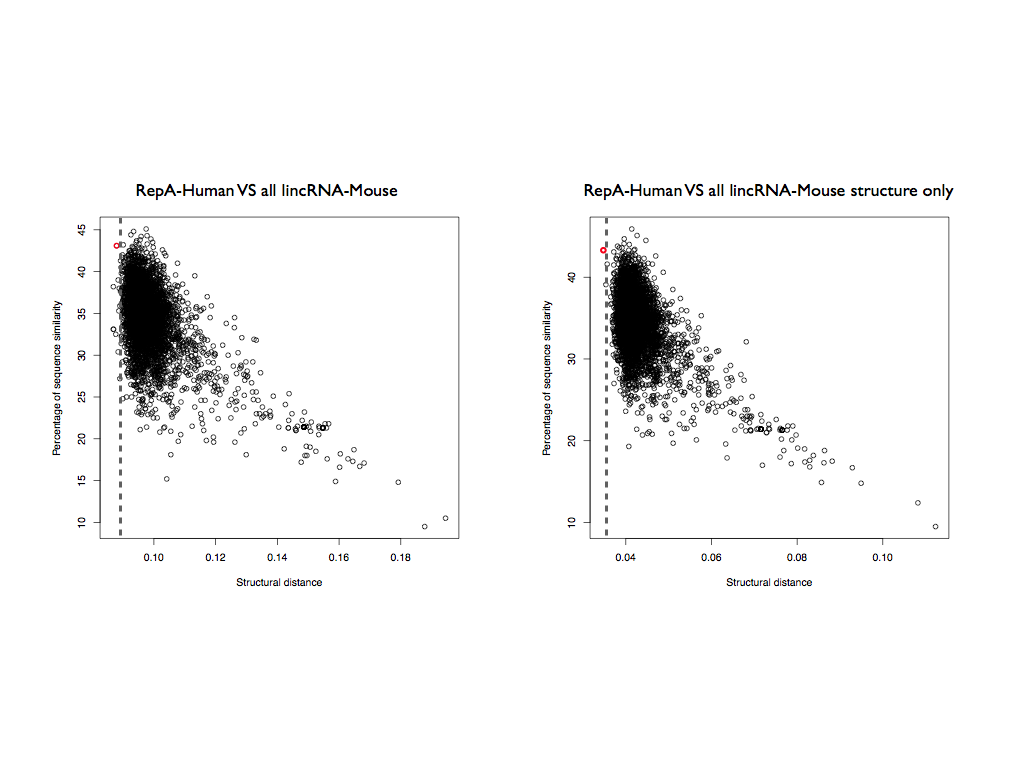
We used CROSSalign to search the RepA-Human inside all the lincRNAs of mouse. In this case, Xist-Mouse is the 5th result (structural distance 0.085; p-value < 10-6; Figure 5a) and the RepA-Human is not correctly predicted (coordinates: 10306-10698).
However, this best interacting region falls approximately inside the regulatory region of the exon 7; this structural relation between RepA and exon 7 could suggest a homology in function.
The real coordinates of the RepA in Xist-mouse are matched as second best result of Xist (structural distance 0.086).
The Rep A of mouse and human are farther both in terms of structural distance and sequence similarity. Previous studies already showed the complexity of the structural homology between human and mouse (Breschi et al., 2017).
We used CROSSalign to search the RepA-Human inside all the lincRNAs of mouse. In this case, Xist-Mouse is the 5th result (structural distance 0.085; p-value < 10-6; Figure 5a) and the RepA-Human is not correctly predicted (coordinates: 10306-10698).
However, this best interacting region falls approximately inside the regulatory region of the exon 7; this structural relation between RepA and exon 7 could suggest a homology in function.
The real coordinates of the RepA in Xist-mouse are matched as second best result of Xist (structural distance 0.086).
 These results suggest that the Rep A is conserved in terms of secondary structure among the primates, but is not well conserved between human and mouse.
However, if we analyzed only the information coming from the structured nucleotides (nucleotides with CROSS score < 0 are set to 0), the RepA-Human matches Xist-mouse as best result, with a highly significant score (structural distance 0.034; p-value < 10-6; Figure 5b).
This result suggests that the unstructured regions can create structural noise, while the double-stranded regions are more conserved in the lincRNA. Moreover, the sequence identity only is not able to correctly identify Xist-mouse, since it is the 14th best result.
All these results are in disagreement with a previous publication, where the RepA was not considered conserved among all the 10 species of the alignment (Rivas et al., 2016). We found a clear signal of secondary structure similarity in the primates and also there is a significant structural homology between the Rep A of human and mouse when looking at the structured regions (double-stranded).
These results suggest that the Rep A is conserved in terms of secondary structure among the primates, but is not well conserved between human and mouse.
However, if we analyzed only the information coming from the structured nucleotides (nucleotides with CROSS score < 0 are set to 0), the RepA-Human matches Xist-mouse as best result, with a highly significant score (structural distance 0.034; p-value < 10-6; Figure 5b).
This result suggests that the unstructured regions can create structural noise, while the double-stranded regions are more conserved in the lincRNA. Moreover, the sequence identity only is not able to correctly identify Xist-mouse, since it is the 14th best result.
All these results are in disagreement with a previous publication, where the RepA was not considered conserved among all the 10 species of the alignment (Rivas et al., 2016). We found a clear signal of secondary structure similarity in the primates and also there is a significant structural homology between the Rep A of human and mouse when looking at the structured regions (double-stranded).
Structural conservation of lncRNAs: HOTAIR
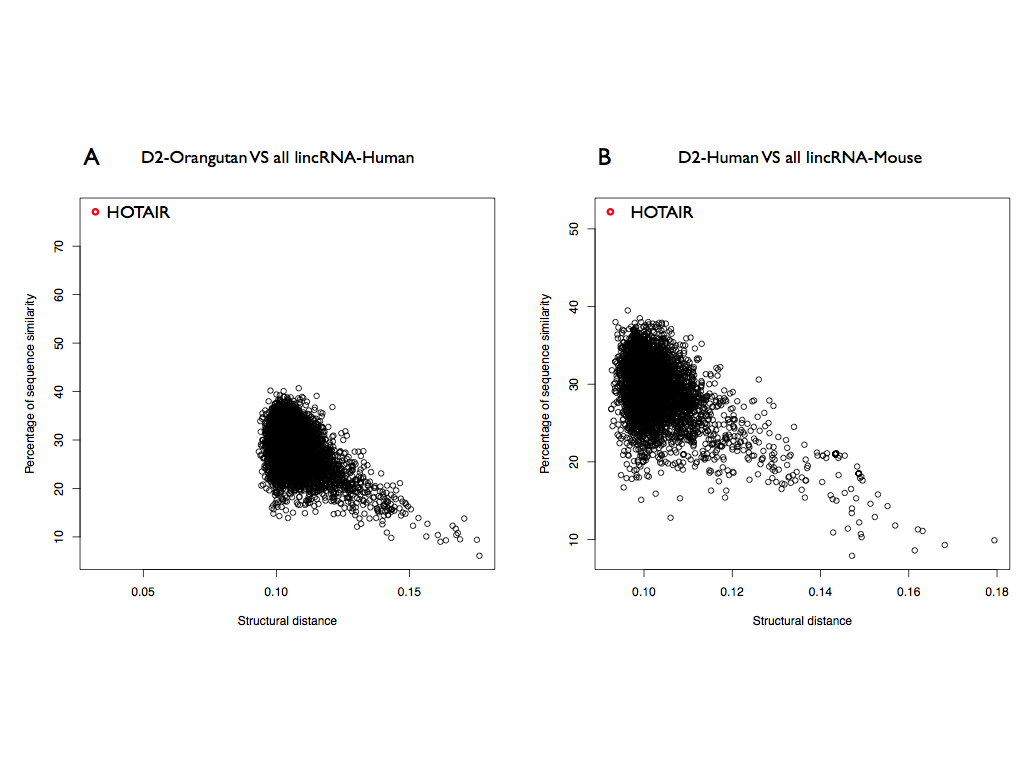
We selected the domain D2, the most structured domain of HOTAIR according to CROSS predictions, to see if is conserved and if we are able to find structural homologi. The D2 of Orangutan was then searched in all the human lincRNAs and HOTAIR is the best result with a significant score (structural distance 0.032; p-value < 10-6) as well as correctly identified in the sequence (predicted coordinates: 666-1191). Interestingly, also selecting D2-Mouse in all the lincRNAs of human HOTAIR is the best result with a significant score (0.092; p-value < 10-4) and also the coordinates are well predicted (coordinates: 284-788; Figure 6b). These results show that the secondary structure of D2 is not only is conserved in the primates, as well as for Rep A, but also in mouse.
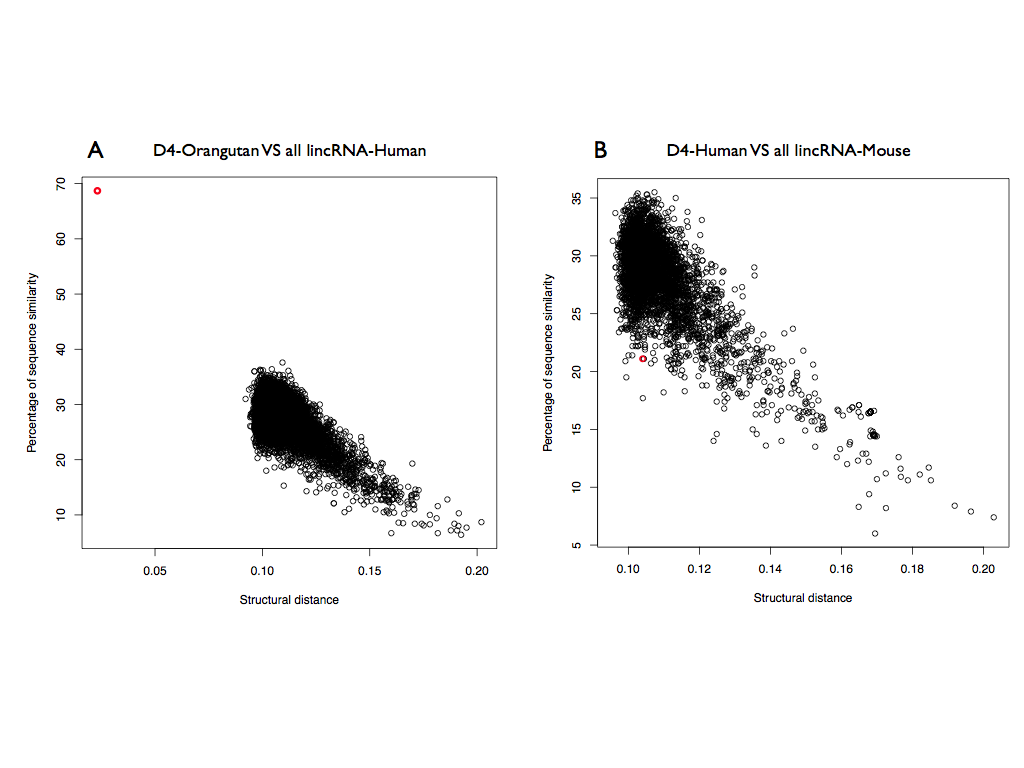
 To further investigate the secondary structure of HOTAIR, we selected the domain D4, the region least structured according to CROSS. Surprisingly, D4-Orangutan is the best results among the human lincRNA (structural distance 0.023; p-value < 10-6), as well as correctly identified in the sequence (predicted coordinates: 1650-2291), showing the expected structural homology between human and primates.
Instead D4-Mouse is the 1849th results for human HOTAIR (structural distance 0.104; p-value = 0.061) showing no structural homology between human and mouse.
To further investigate the secondary structure of HOTAIR, we selected the domain D4, the region least structured according to CROSS. Surprisingly, D4-Orangutan is the best results among the human lincRNA (structural distance 0.023; p-value < 10-6), as well as correctly identified in the sequence (predicted coordinates: 1650-2291), showing the expected structural homology between human and primates.
Instead D4-Mouse is the 1849th results for human HOTAIR (structural distance 0.104; p-value = 0.061) showing no structural homology between human and mouse.
 All these results show that a structural homology is possible for lncRNA, especially for more closely related species such as human and primates, while human and mouse are farther and more different in terms of structural homology. However, while looking at structured regions the conservation is more evident, as previously shown for human and mouse, but also more structured regions such as D2 are more conserved then the unstructured ones, such as D4.
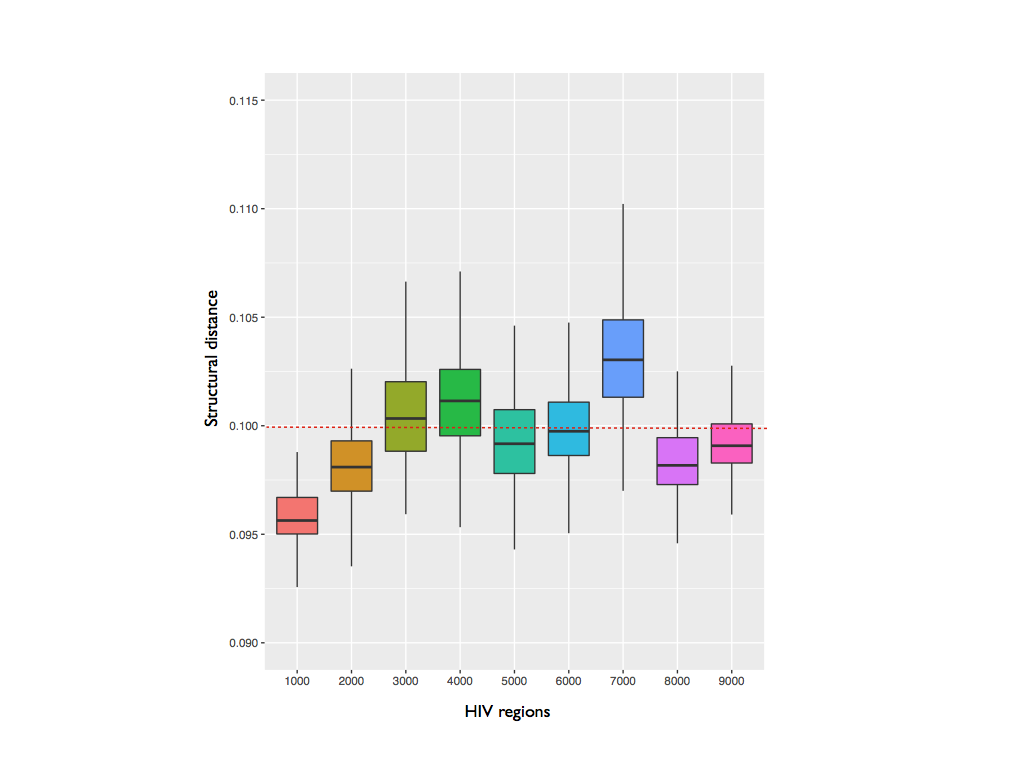
Viruses
HIV is one of the most studied viruses and its secondary structure was analyzed and characterized (Watts et al, 2009). We divided HIV in not overlapping domains of 1000 nucleotides. All the domains were searched against the ss-RNA viruses having as host human, or in some cases primates (292 cases, downloaded from NCBI), in order to find some regions of structural homology. Our results suggest that the 5’ UTR is the region most conserved along all the viruses. This result can indicate that the secondary structure of this domain is not important only for the encapsidation of HIV, but can be a fundamental structural domain essential for the activity of all the viruses.
DTW
We used the R package dtw (Giorgino, 2009) for the Dynamic Time Warping. To search a domain inside a larger molecule, the algorithm was set with open begin and end (OBE), to search the optimal match without constrictions. The latter was optimized to search profiles of different length, since it was shown that comparing two profiles of similar length is not different from doing an interpolation (Ratanamahatana et al., 2004). While the normal DTW imposes the same begins and ends to both profiles, therefore stretching the shorter one, the DTW-OBE finds matches of the shorter profile without any stretching. Therefore, DTW-OBE is useful to search structural modules inside longer sequences (such as RepA inside the complete Xist sequence). The structural distance was computed with an asymmetric pattern and using the Manhattan distance, optimal for profiles of different length. To avoid biases regarding the length of the profiles, the final structural distance is always normalized for the length of both profiles using the internal function normalizedDistance. Different normalizations are usually applied to DTW (shorter profile, longer profile), but the normalization based on the length of both profiles is the best option to avoid any bias. The function index was used to visualize the matches between the shortest and the longest profile.
CROSS algorithm
The secondary structure profiles were generated using CROSS. If not specified, all the profiles were generated using the Global Score modules. The score was never smoothed. While considering the structural content, nucleotides with a score higher then 0 are considered double-stranded and structured, while nucleotides with a score lower than 0 are considered single-stranded. Since the tool has no sequence length restriction, it is fast, optimized with lncRNA and it has a profile as main output, it is the best alternative to be integrated inside a Dynamic Time Warp algorithm in an analysis of lincRNA or viral genomes. Other tools, like RNAstructure or RNAfold cannot be used for such task since they are heavily restricted on the sequence length (maximum ~1000nt).
p-values
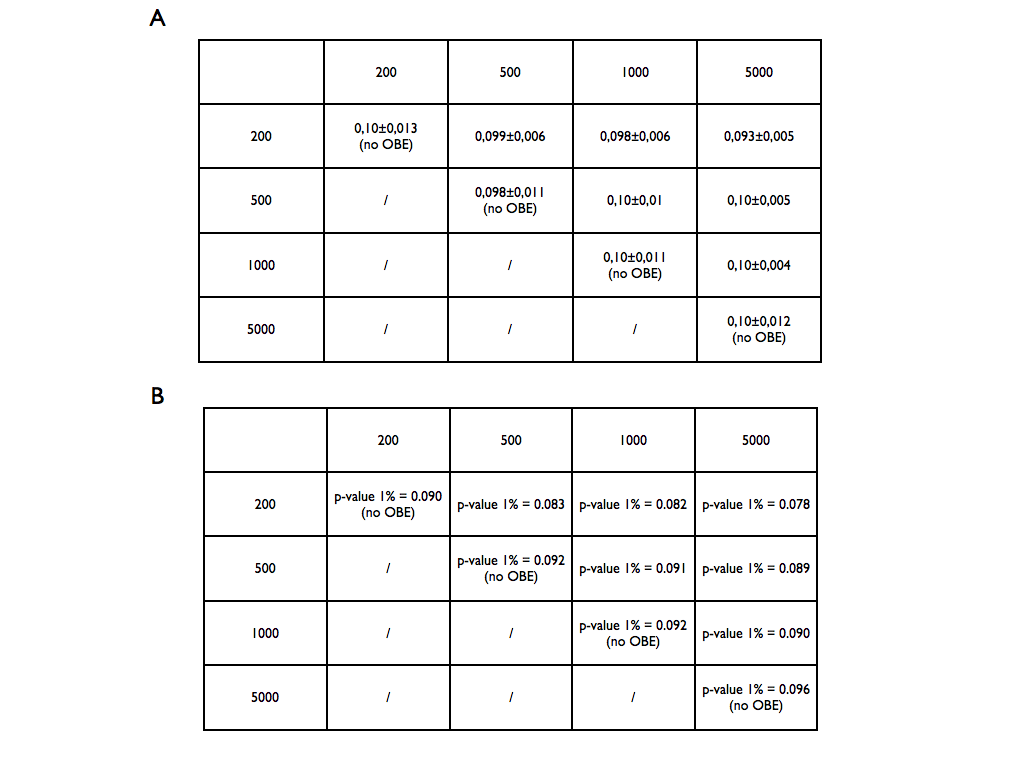
To compute the p-values we used existing human lincRNAs of different lengths (200, 500, 1000, 5000). Using ~100 molecules for each class, we computed the structural distance between all the couples of every comparison-size (~10’000). The obtained distributions were used as reference set to compute the p-values for a new case. The lengths of a submitted couple will be compared with the closer length of the reference set. The p-value will be then computed comparing the scores more significant than the target on the entire reference distribution. In the tables below are reported a) the mean and the standard deviation of the reference distributions and b) the score corresponding to the p-value significant at 1%.