CROSSalive Tutorial
CROSSalive predicts the RNA secondary structure in vivo using contribution from 1) RNA sequence and 2) proteins predicted to interact with it. CROSSalive profiles the RNA structure at single nucleotide resolution and is validated on icSHAPE.
Submission
The server automatically assigns a reference number to each submission. As input the user can paste one or multiple RNA sequences in FASTA format into the dedicated form. The user can provide an email address (optional) to receive a notification when the job is completed. The algorithm will process only standard nucleotides (ACGTU). Do not use symbols like !@#$% etc.

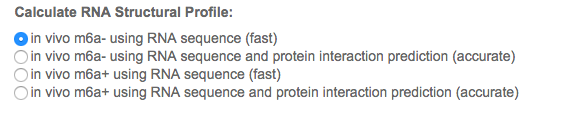
The user can select between 4 different models. The models were trained on icSHAPE in vivo data with (m6a+) and without (m6a-) m6a methylation events, which it was shown to have an effect on the structure (Spitale et al. 2015).
Depending on the condition to study and the typology of the RNA to profile, the user can prefer one model compared to the other. Moreover, the information coming from different models can be very valuable to identify structural regions affected by methylation events. The models can be used without the proteins contribution, which decreases the performances (check Documentation for more details), but the time required for the calculation will be at around 10 times smaller. Thus, the models without the proteins are recommended to profile long and complex RNAs very quickly.
See the Documentation for more details about the datasets.
The form can also be pre-populated by clicking on the provided sample data at the bottom of the submission page. The algorithm will compute the complete secondary structure propensity profile of the Rep-A of Xist using the m6a+ sequence only model.

General information
The algorithm has been trained on RNA sequences of different lengths and characteristics. Due to the predictions of protein-RNA interactions, CROSSalive handles sequences longer than 50 nucleotides (we set the minimum to 70 nucleotides to include the 3’ and 5’ regions, see Documentation). Processing a single RNA of 70 nucleotides takes less than 1 minute without using the proteins. As for the time required to predict secondary structure propensities using the proteins contribution, the analysis could take around times longer, especially for long non-coding RNAs such as Xist (18000 nt) that could take also up to 1 hour to profile, depending also on the overloading of our servers. To avoid overloading the server and to generate the output file in a convenient format, the webserver is optimized to process a maximum of 20000 nucleotides.
Please have a look at the table below to have a general idea regarding the computational time to execute different jobs when our servers are free.

Browser compatibility
We ensure that our algorithm is compatible with the latest versions of Mozilla Firefox and Google Chrome. We are relying on the latest web technologies and we do not require any extra plugin installation. Should you experience any problems when uploading files, please ensure that your internet connection works properly and there are no proxies/firewalls blocking the transfer in between you and our servers.
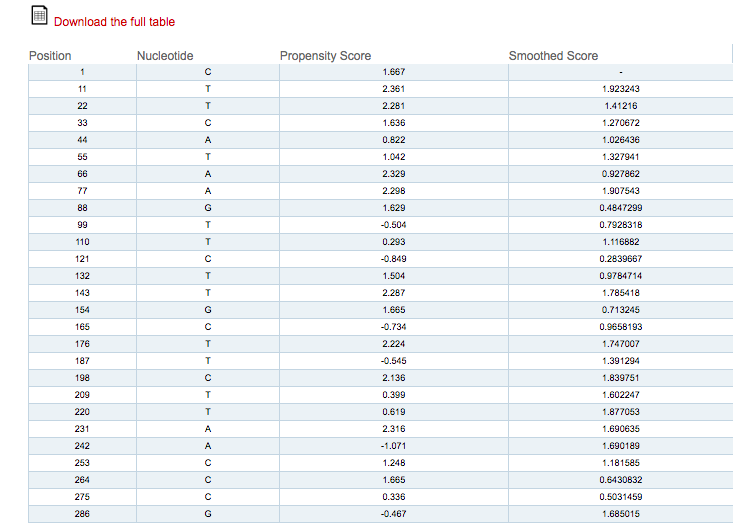
After the submission is completed, the algorithm processes the RNA sequences using the experimental model previously selected. For each sequence of length n the algorithm computes its secondary structure propensity profile at single nucleotide resolution, from nucleotide 25 to n-25. To calculate the scores for the first and last 25 nucleotides we employ periodic boundary conditions: we append a copy of the last 25 nucleotides at the 3’ end to the 5’ end and vice versa. The scores of the first and last 25 nucleotides are then calculated using fragments containing nucleotides from the respective other end. The predicted secondary structure propensity scores lie in the range [-1, 1]. A score in the range (0, 1] means that the nucleotide is predicted to be in a double-strand, while a score in the range [-1, 0) indicates that the nucleotide is single stranded. To generate a better visualization of the profile, we apply a length-dependent dynamic smoothing. A scrolling table shows a sample of the total nucleotides (depending on the smoothing window) with both the raw and the smoothed propensity score. The user can easily download the table with the complete data (raw and smoothed) by clicking the provided link. The symbol “-” indicates nucleotides outside of the smoothing window where the smoothed score is not available. Please refer to the raw propensity score for these cases.
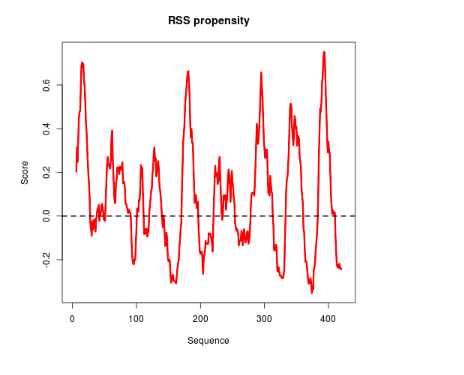
To show the distribution of the secondary structure propensity scores, the algorithm generates a visualization of the profile using R. The profile is smoothened using a running mean with a dynamic window size linearly dependent on the length of the sequence. This image can be downloaded in PNG format.