OmiXcore
To predict protein interactions with human long nonconding RNAs (lincRNAs) in one-shot, we implemented the OmiXcore algorithm. OmiXcore integrates the information coming from protein and >14,000 lincRNA fragments into an overall binding propensity value. The algorithm has been trained on datasets of 96 RBP studied by eCLIP assays (Van Nostrand et al. 2016). Performances were evaluated by leave-one-out approach (LOOV) achieving an area under the ROC curve AUC >0.8. OmiXcore method is based on a non-linear algorithm trained on the interaction propensities of protein fragments for RNA regions. (Cirillo et al. 2013) to predict binding affinities (i.e. read counts normalized by expression levels). The model can be also used to identify local binding sites onto the sequence of specific transcripts of interest. By providing both global and local predictive values, OmiXcore is particularly useful to prioritize candidate interactions on a large-scale and investigate binding sites, in particular for lincRNAs.
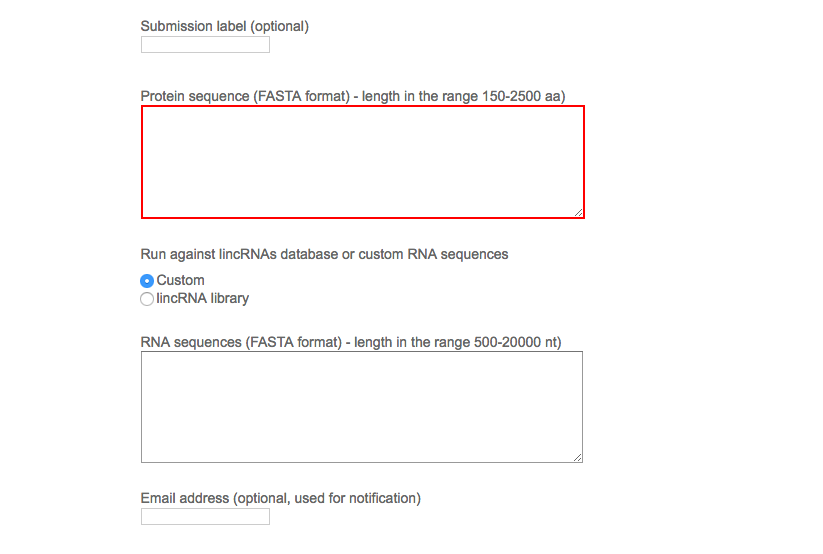
The server automatically generates a unique reference number for the submission. The user can optionally choose a custom submission label and provide an email address to be notified on the job completion (optional). Once the sequences of one protein is provided in FASTA format, the user is asked to choose between a default set of >14,000 human lincRNAs or a user-secified list of RNA sequences in FASTA format.
By clicking the “Submit query” button, the job is submitted to the computation queue and the user can load the output page that is refreshed every 10 seconds. The user can bookmark the output page and check later the results.
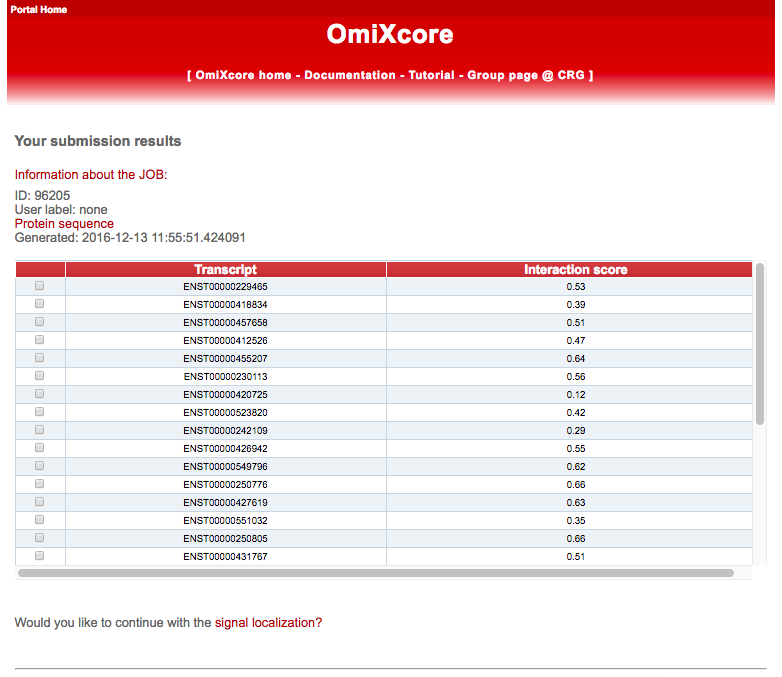
The output of OmiXcore consists of a table reporting the list of transcripts and the associated Interaction score (or Global Score). The Interaction score is computed integrating the propensities of individual RNA fragments through an non-linear algorithm trained on eCLIP data (Van Nostrand et al. 2016). The Interaction score represents a measure of binding affinity, i.e. eCLIP read counts normalized to gene expression levels (Djerbali et al. 2012). At this point, the user can select single transcripts to compute the Signal Localization by clicking on Would you like to continue with signal localization? at the end of the page.
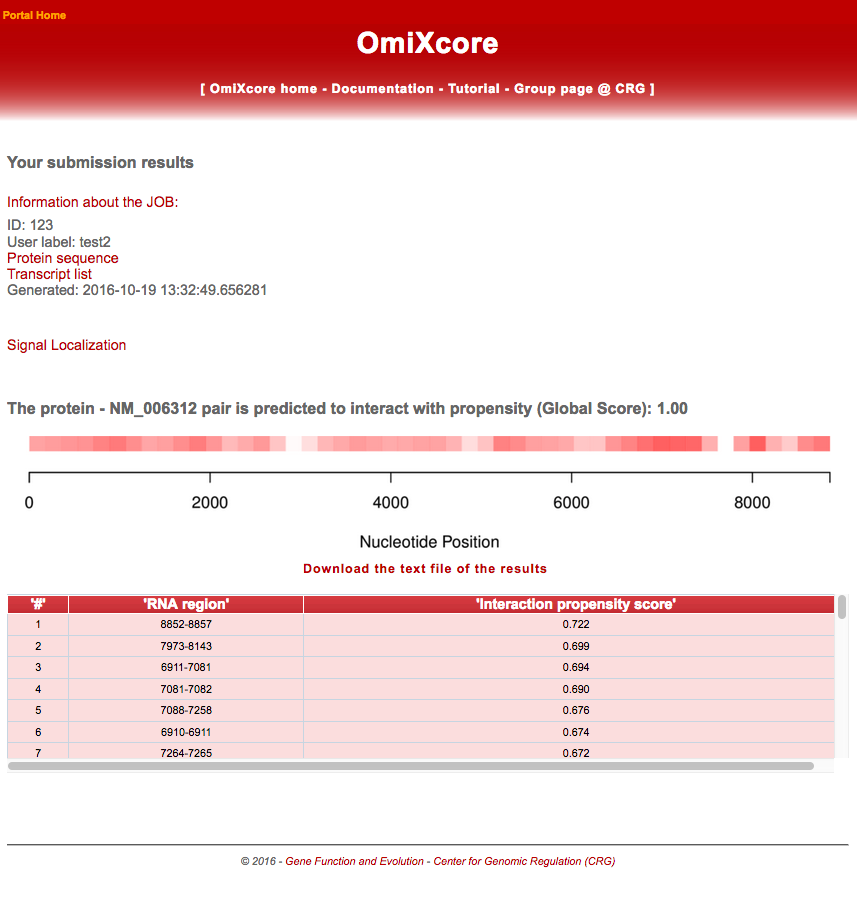
The output page of Signal Localization reports the Interaction score (Global Score) of the RNA-protein pair and the localization of the signal along the RNA sequence colored according to normalized values. The outcome of the ANN on the individual RNA fragments is used to localise high-confidence binding sites. The Interaction scores are reported in a table below the graph as well as in a downloadable text file.
Running time
Please note that running times are different bewteen Custom and lncRNAs mode. In Custom mode the time increases with RNA length. For instance, in the case of a protein of 900 aa in length against Xist (~18K nt) the time to compute the interaction and to visualize the binding is 10 and 10 minutes respectively. In lncRNAs mode, using the same protein, the time to compute the non-coding RNA interactions and to visualize the binding is 25 and 3 minutes respectively.
The positive and negative set that were used to train the algorithm are available to download here, and here accordingly. The correpsonding binding sites for the two independent cell lines (K562 and HepG2) were retrieved form the www.encodeproject.org in .bigBed format. The corresponding metadata file to download the bigBed files is available here (HepG2), and here (K562).