PAnDA Tutorial
PAnDA (Protein And DNA Associations) allows fast and accurate prediction of TF binding events.
Submission form
As soon as the PAnDA module is selected, the server generates automatically a unique Submission reference number. The user can optionally supply a custom Submission label and an Email address to receive the notification of job completion.

The user is than asked to select a Run mode for the calculation. PAnDA Default mode is recommended for majority of users. Default submission uses a set of parameters proved to be the optimal ones during the algorithm training phase. The optimal parameters used in Default mode are:
Motif |
Classifier |
Cofactors |
Mediated cofactors |
|---|---|---|---|
KNN | 0.1 | 0.4 | |
SVM | 0.1 | 0.1 | |
Adaptive Boost | 0.2 | 0.1 | |
SVM | 0.1 | 0.1 | |
SVM | 0.3 | 0.2 |
** Quantiles are descriptors for the span of a distribution (e.g. here 0.1 quantile means top 10% of all observations; 0.5 quantile means the median). During PAnDA training (275 ENCODE TFBS ChIP-seq datasets), several learning models have been evaluated based on interaction networks that satisfied various combination of quantiles of Cofactors and Mediated cofactors expression levels. Parameters used in Default mode proved to be the optimal ones during the algorithm training phase.
PAnDA Expert mode uses parameters selected by the user.
The user can choose one or all of the listed Motifs databses and available Human cell lines to use in the analysis.
Cofactors and Mediated cofactors expression thresholds will be employed to filter the components of the interaction networks.
After choosing the Machine learning method for the model generation, the user is asked to select the Interaction databases to be employed for the recontruction of interaction networks.
Regardless of the submission mode, users must select a cell line of interest.
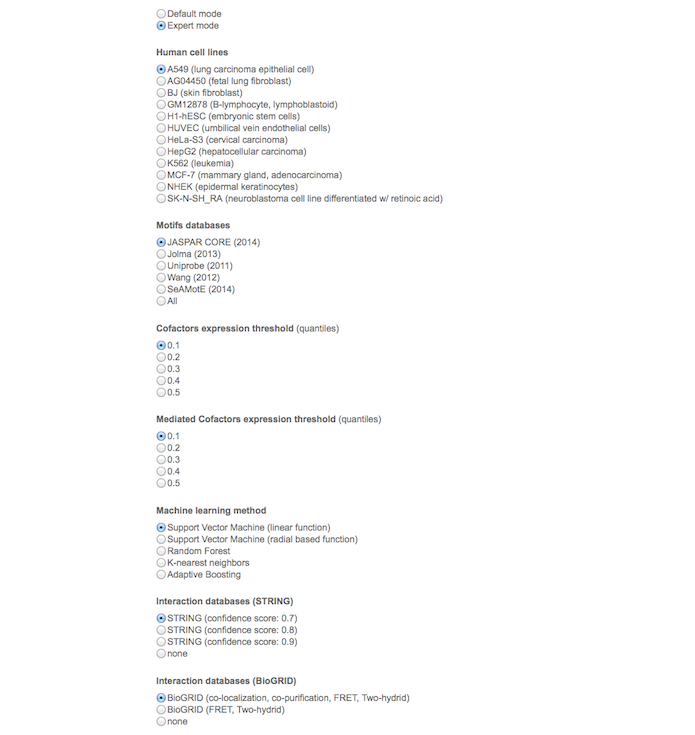
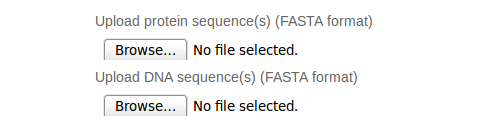
Finally, the user is asked to provide a list of sequences in FASTA format as input file (Protein and DNA sequences).
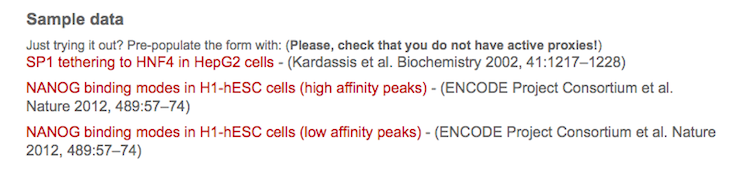
Once the job has been submitted, the link to the result page will be provided. In addition, the user can pre-populate the form by using illustrative cases (Sample data).
Interpreting the output
Let’s try PAnDA with one example. Click on the link SP1 tethering to HNF4 in HepG2 cells.
FASTA sequences of human Hepatocyte Nuclear Factor 4 (HNF4) and -890/+24 apoCIII promoter region will be uploaded.
Binding propensities will be predicted using the Default mode.
In HepG2 cell line, the synergistic interaction between HNF4 and Specific Protein 1 (SP1) permits the activation of apoCIII promoter (Kardassis et al. Biochemistry 2002, 41:1217–1228).
PAnDA is able to identify SP1 tethering to HNF4 as well as other associations.
In particular, the functional roles of RXRA (Takahashi et al. FEBS Lett 2009, 583(2):493-7), CEBPB (Kan et al. Biochemistry 2004, 43(17):5084-93) and YY1 (Yao et al. Mol Cell Biol 2001, 21(17):5979-91) in apoCIII promoter transactivation and adipocyte differentiation are reported.
Once the prediction is completed, the result page will present a summary of the job and results.
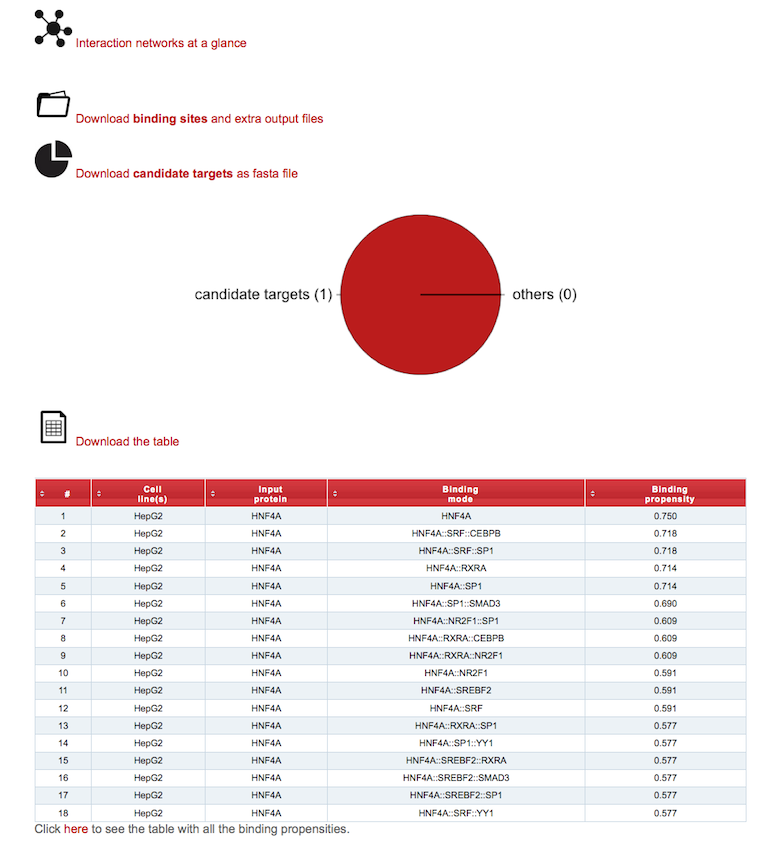
The output consists of a table listing the distinct Binding modes of the Input protein(s) to the input DNA sequence(s) in the selected Cell line(s).
Binding modes are noted using double colons (::) to separate layers (from right to left, layers from 1 to 3).
Layers are defined as branches of the Input protein interaction network involving the Input protein (layer 1), its interactors (or cofactors; layer 2), or the interactors of the latter (or mediated cofactors; layer 3).
Binding propensities for every binding mode are reported in the column of selected motif database. Due to parameter fitting during the training phase, propensities may slightly fluctuate over the third digit after the decimal point.\
A pie chart shows the fraction of DNA sequences that contains binding sites of factors in the network that are predicted to be relevant for the binding of the input protein.
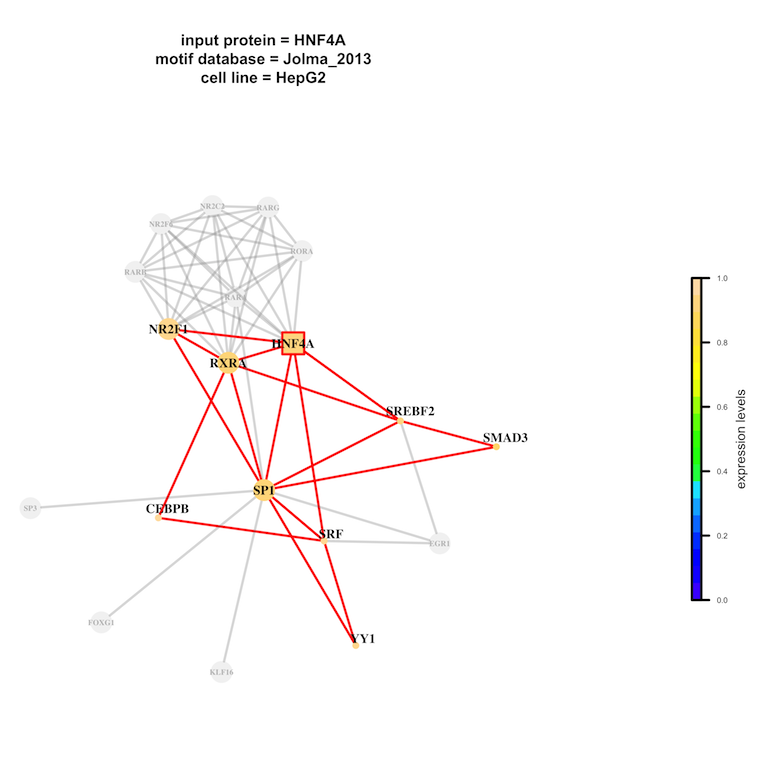
The element log file will report a summary of the job. Clicking on the link(s) below the section Interaction Networks a lightbox will display input protein(s) networks as reconstructed using the selected motif database(s). Networks are represented using specific shapes: squares for input protein(s) and circles for all the other factors. The size of the nodes is proportional to motif counts in the input set of DNA sequences. A color palette refers to expression levels (from blues to yellows, lowly to highly expressed in the selected cell line). Factors in the network that are predicted to be not relevant for the binding of Input protein(s) onto the Input DNA sequence(s) are colored in grey. Using the link above the table, the user can download the complete table in TXT format and extra output files (binding sites, domain search, graphics, etc.) as a gzip compressed tar archive.
Binding sites are reported for the components of the network ("Binding drivers") that are predicted to mediate the binding of the input protein. The name of DNA of interest (as provided by the user) and the position of the regulatory motif is reported in Input_DNA:coordinates.

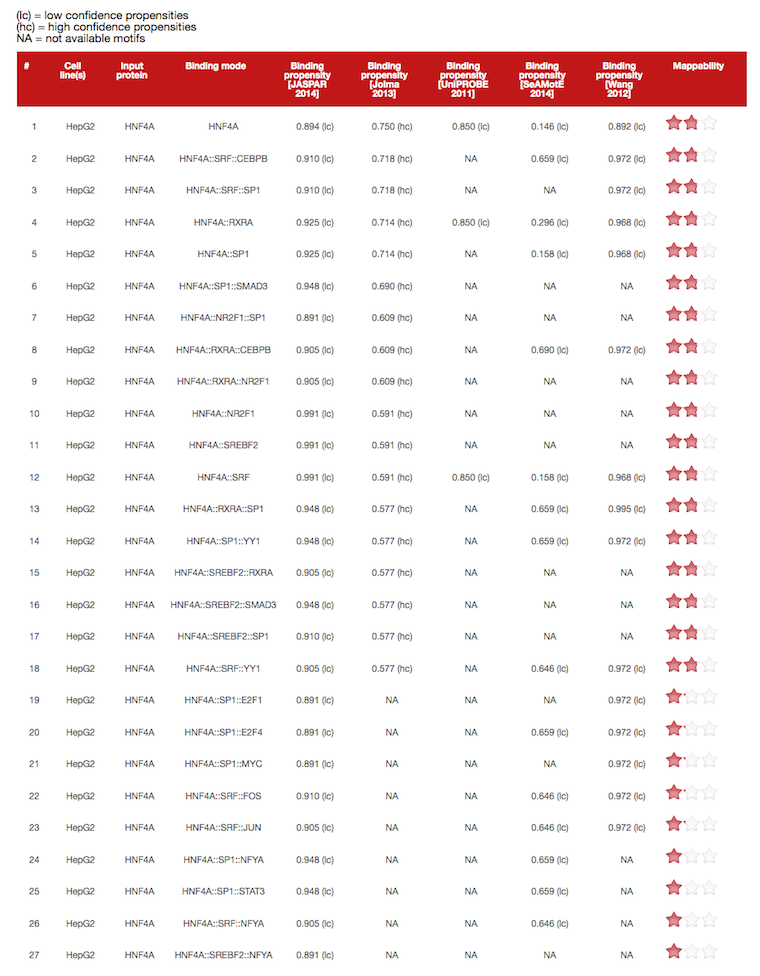
By clicking on the link below the table, a new page with all the binding propensities is automatically displayed. This table reports all the predictions for every motif database. (hc) symbol (high confidence) is assigned to identify binding propensities predicted by using the motif database with the highest mappability (i.e. the number of motifs covered by cofactors and mediated cofactors in each TF network considering their specificity or motifs size). (lc) symbol (low confidence) and NA (not available motifs in the corresponding database) are assigned to all the other binding propensities.
To orientate the interpretation of the results, users can refer to optimal cut-offs that we estimated to select high confidence positive predictions (i.e. values higher than those are defined as positives):
Motif |
model 1 |
model 2 |
model 3 |
model 4 |
|---|---|---|---|---|
UniPROBE (2011) | 0.50 | 0625 | 0.667 | 0.615 |
Wang (2012) | 0.487 | 0.282 | 0.311 | 0.479 |
Jolma (2013) | 0.50 | 0.507 | 0.499 | 0.499 |
JASPAR (2014) | 0.50 | 0.493 | 0.444 | 0.460 |
SeAMotE (2014) | 0.50 | 0.219 | 0.275 | 0.656 |
Performances of an independent validation
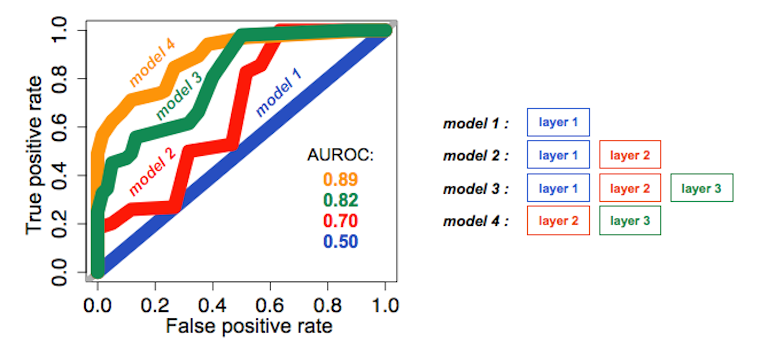
Here, we report performances of PAnDA algorithm on ChIP-seq data (ENCODE Project Consortium, Nature 2012, 489(7414):57-74). The systematic integration of interaction network layers increases the performances (Areas Under the ROC curve, AUROC) of the prediction of ChIP-targeted TFs binding events (see figure below; motif database: UniPROBE). Model 1 has been trained using instances of target TFs. Model 2 has been trained using instances of target TFs and cofactors. Model 3 has been trained using instances of target TFs, cofactors and mediated cofactors. Model 4 has been trained using instances of cofactors and mediated cofactors. Performances on specific networks from the testing set are reported (AUCs = Areas Under the ROC curve).
Supplementary documentation
Table 1

Training and testing datasets. Target TFs and related cell lines were retrieved from ENCODE Transcription Factor Binding Sites ChIP-seq tracks, June 2012 freeze uniform processing.
Table 2
Motif databases. Repositories of annotated PWMs implemented in PAnDA.
Table 3
Recognition motifs of TFs and human homologues.