Datasets submission
The usage of our tools is extremely simple. When a new submission is desired, user is presented with following simple form (screenshot):
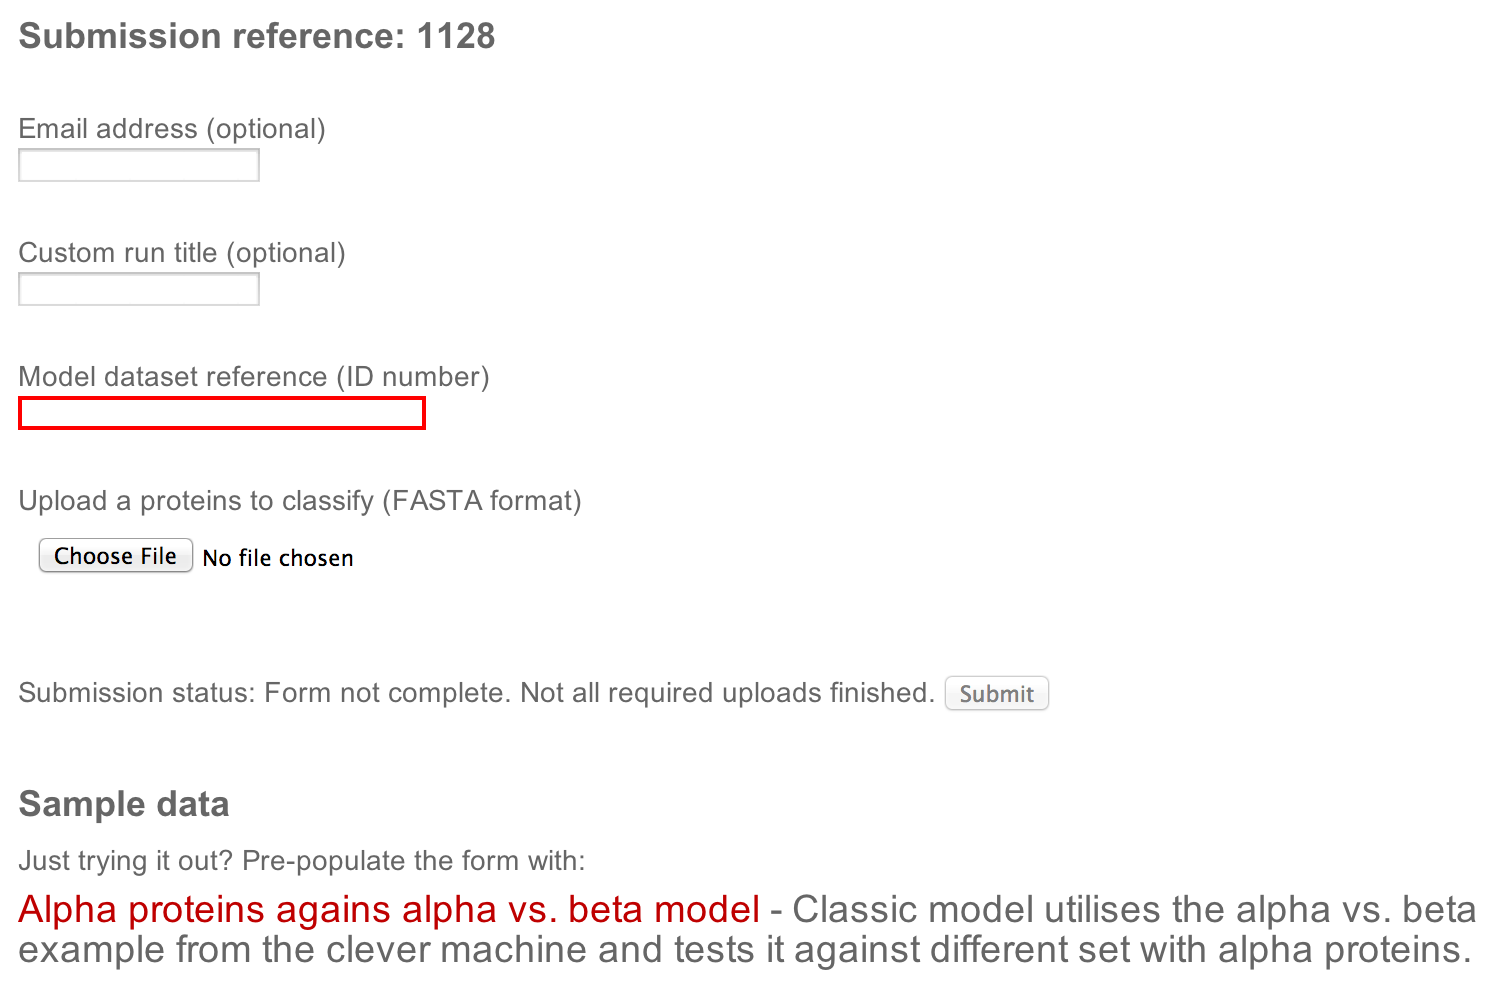
The form has following components:
-
Basic information
Run title and email address. Both are optional, however, the email address needs to be either empty or filled in and valid. Arbitrary text in the email field will prevent submission.
-
Input data
A model dataset number (from cleverMachine) and a dataset with FASTA sequences to be classified - those are the only required fields.
-
Submission status
This field is periodically updated and informs user about the status of the submission. The submit button is inactive until all of the required information is provided.
-
Sample data
Here an updated list of examples is provided. This can be used to try out the tool without the need to have any datasets ready. A single click to a dataset of your choice pre-fills all the field required for successful submission.
Output interpretation
The usage of our tools is extremely simple. When a new submission is desired, user is presented with following simple form:
Classification
The most important piece information right at the top, under the Classification
heading is the determined assignation of the dataset.
Information shown here quantifies similarity of the new dataset to
the positive and negative parts of the reference dataset.
Scale combinations
Once it is determined where the dataset belongs, a new combination plot is created using the oposite dataset as a reference. For example, if the new dataset (marked as X) is very similar to the positive dataset, the discrimination is ran agains the negative dataset to obtain most of the contrast.
The result of the discrimination is then shown side-by-side with the reference result, making it very easy to spot similarities/differences with individual coverages. The plot is described in more detail in the relevant section of the cleverMachine tutorial
Combination statistics
The combination statistics are showing results from the reference, as those are the same values used for classification
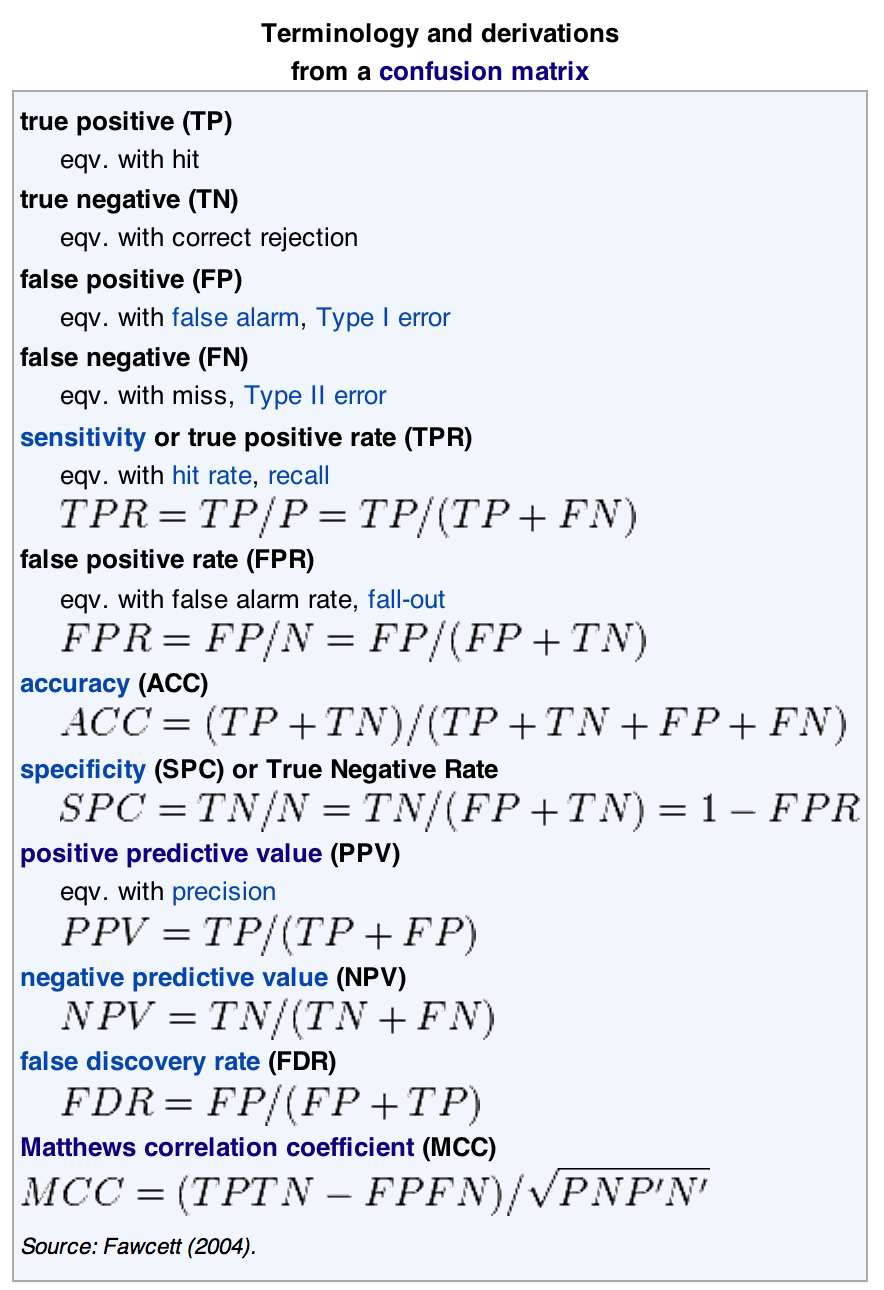
Statistics are shown both for the combination's total and for the individual scales. The individual abbreviations are all standard statistica and can be found in the table shown on the RHS.
There is also an additional piece of information shown right in front of the individual properties - it is a sign and is either + or -. It is a simple abbreviation of a direction of a property. If a + is shown, it means that the property is stronger on the positive dataset and vice versa (for example, the + means that same as the bar pointing left for individual properties and a bar pointing up for groupings).
Score browser
The last view the classifier's output is the score browser. It complements the whole-dataset view from the first section and contrasts it with individual comparison scores.
The table itself contains a record for each of the entries from the X dataset.
In each of the columns, a comparison score is shown. It shows a percentage in
how many cases was the X dataset stronger/weaker than the opposing set.
The top header also shows what is the expectation given the property directions
in the training model, + means strong property on Positive and - on reference.
All of the above would be easy to understand once I present an example. For sake of simplicity, let us assume that the X dataset was closer to the positive set. If that was the case and top of the column said +, the expectation would be that the score in that particular column is over 75% (if the dataset was closer to the negative, the expectation would be below 25%, see Comparison steps in the documentation.
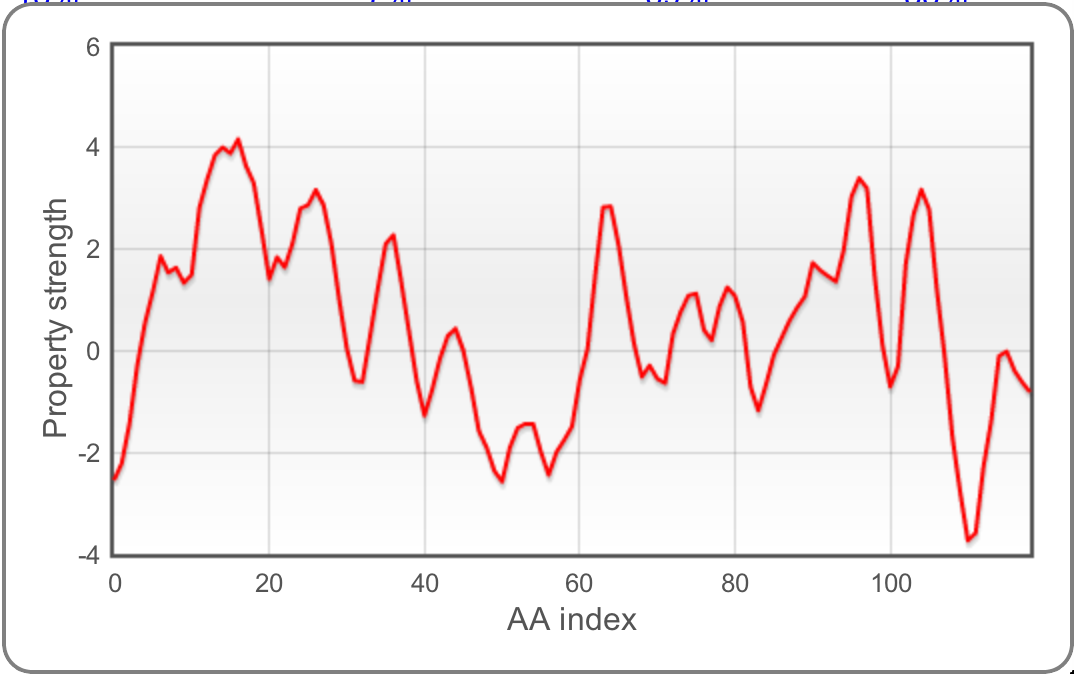
We realise that interpretation of the raw scores is not as simple as it could be and would be left for andvanced exploration at this moment. However, what is more useful is what happens after clicking the score - a scale profile of the individual protein is drawn. This shows per-aminoacid score of the selected property, allowing to judge overall property stability.
Combined usage
The "clever" suite's components can be used individually, but together they form a workflow for signal detection and dataset cross-validation. The user is free to provide different data for training and test phase. The classifier is useful for further analysis and predictions.