The catGRANULE algorithm
The tendency to assemble into foci is predicted using RNA binding and structural disordered propensities identified through a computational screening (Klus et al. 2014), as well as amino acid patterns and the polypeptide length. We selected the combination of RNA-binding and structural disordered predictors that best discriminates proteins with potential for foci formation (120 genes Granule Forming from Mitchell et al. 2013) from the proteome (4,145 proteins excluding 770 genes from Sopko et al. 2006 and 777 genes from Makanae et al. 2013). To cross-validate our predictions, we used an independent set of genes identified through a QuickGO search with query granules (16 proteins in common with granule forming and 64 granule related). The granule propensity (g) of an amino acid s at position i is defined as
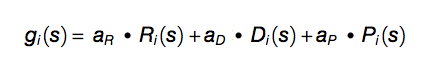 (Equation 1)
where Ri = (RC,RN)i are the amino acid propensities of classical RC and recently discovered RN RNA-binding proteins (Castello et al. 2012), Di = (DC,DB)i estimates the structural disorder content based on coil DC and bending DB features (Deléage and Roux 1987; Isogai et al. 1980), Pi = (PRG,PFG)i takes into account arginine-glycine and phenylalanine-glycine content (Kato et al. 2012; Thandapani et al. 2013). Each property is calculated on a heptapeptide centered at position i in the sequence. The overall granule propensity is calculated as
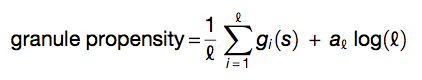 (Equation 2)
where  is the sequence length.
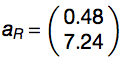
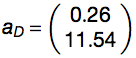
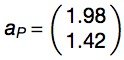
By using Monte Carlo method, coefficients were determined as follows:
is the sequence length.
By using Monte Carlo method, coefficients were determined as follows:

The performances of the algorithm was assessed using a 5-fold cross-validation (area under the receiver operating characteristic (ROC) curve, AUC, of 0.86 for granule forming genes) and on an additional set (AUC of 0.72 for granule related genes). With respect to dosage-sensitive genes identified by Sopko et al. 2006 and Makanae et al. 2013, AUCs are 0.65 and 0.69. Gene groups are accurately discriminated even when DNA-binding proteins are removed from original sets (Sopko et al. 2006: AUC = 0.64; Makanae et al. 2013: AUC = 0.67). Elimination of sequence length contribution from Equation 2  marginally reduces overall performances (granule forming: AUC = 0.80; granule related: AUC = 0.70).
To visualize the granule propensity g̃i of each amino acid i we average gi(s) on a sliding window of 50 amino acids and Z-normalize the score (mean 0 and SD of 1 on the yeast proteome). The granule strength is calculated using the fraction of amino acids with g̃i > 0:
marginally reduces overall performances (granule forming: AUC = 0.80; granule related: AUC = 0.70).
To visualize the granule propensity g̃i of each amino acid i we average gi(s) on a sliding window of 50 amino acids and Z-normalize the score (mean 0 and SD of 1 on the yeast proteome). The granule strength is calculated using the fraction of amino acids with g̃i > 0:
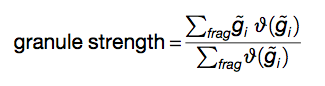 (Equation 3)
where  is the Heaviside function that is 1 if x > 0 and zero otherwise on the fragment of interest (frag).