Introduction on the Thermometer server
Assessing protein thermal stability is still a challenge. Indeed, knowing the temperature at which proteins are stable has important theoretical implications, which are intimately linked with properties of the native fold, and a wide range of potential applications from drug design to the optimization of enzyme activity. To this aim, we developed Thermometer, a tool based on a graph-theoretical framework able to assess thermal stability of a protein structure without any a priori information. In this approach we describe proteins as energy-weighted graphs and compare them using ensembles of interaction networks. Investigating the position of specific interactions within the 3D native structure, we developed a parameter-free network descriptor that permits to distinguish thermostable and mesostable proteins with an accuracy of 76% and area under the receiver operating characteristic curve of 78%.


Method
Protein representation as Residue Interaction Network
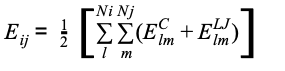
At the basis of this method, there is the representation of each protein structures as a Residue Interaction Networks (RIN), where each protein residue, ai, corresponds to a node. Defining the nearest neighbour atomic distance between a given pair of residues ai and aj as dij, two RIN nodes are linked together if dij ≤ 12 A. Finally, each link is weighted by the sum of two energetic terms: electrostatic and Lennard-Jones potential. The electrostatic contribution between two atoms, l and m, is calculated as in
 (Equation 3)
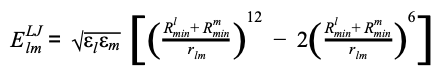
where ql and qm are the partial charges for atoms l and m, as obtained from the CHARMM force-field: rlm is the distance between the two atoms, and ε0 is the vacuum permittivity. The Lennard-Jones potential is therefore given by:
 (Equation 4)
where εl and εm are the depths of the potential well, Rlmin and Rmmin are the distance at which the potential reaches its minimum.. The weight of the link connecting residues ai and aj is calculated by summing the contribution of the single atom pair as reported in equation
 (Equation 5)
where Ni and Nj are the number of atoms of the i-esime and j-esime residues. To each node, the strength local parameter can be defined as:
 (Equation 6)
where the strength Si of the i-esime residue is calculated as the sum of all energy terms for that residue.
Network randomization
To each real RIN, an ensemble of randomized networks are built. The randomization procedure proceeds as follows:
- Pick a link having energy weight Eij and distance of interaction dij ;
- Substitute the energy with a new one (E'ij) extracted from a energy distribution
- Repeat points 1 and 2 for each link of the real network
Distance intervals are defined using a binning of 0.5 A width over the distance from 0 A to 12 A, obtaining 24 different ranges. For each distance interval k, we generated a probability density function ρk(E) , using only the energies values observed in such intervals in a reference mesostable proteins dataset (see Dataset). Distributions can be computed using both Coulombic energies and LJ energies, only negative or only positive energies or combinations of the previous contributions.
The procedure is applied M (=500) times for each RIN, so that each real network is associated with M random network (rRINs). The strength averaged over all the network nodes was computed for each rRIN, obtaining a distribution of mean strength values for each protein. From the random ensemble, a global mean strength value s and a local (i.e. residue specific) one, si, can be computed, together with their root mean square variances, σ and σi.

The Thermometer descriptors
Ts global descriptor
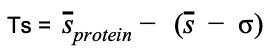
Starting from the strength values, the Ts global score is defined as.
 (Equation 7)
which provides a measure of how much the original RIN mean Strength value, sprotein deviates from the expected value of a rRIN distribution; s and σ are the mean and standard deviation of the mean values of the rRIN distribution. Depending on which kind of energy distribution has been used in the randomization process, different Ts scores can be defined, i.e. total energy Ts if the random ensemble is built sampling energies from the total energy (Coulomb+LJ) distribution; negative Ts, if only negative energies has been used, etc.

Tsi local descriptor
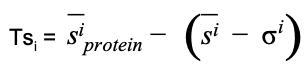
As for the global case, a Tsi local score can be defined as
 (Equation 8)
where siprotein is the Strength of residue i, while si and σi are the mean and standard deviation values of the strength of residue i computed using the ensemble of random networks.
The Datasets
Mesostable energy distributions are built from a set of 45 proteins with experimentally known melting temperature values (Tm) below 70 C°. The dataset was obtained from the ProTherm database (see Reference article for details). In brief, we selected all wild-type proteins for which the following thermodynamic data and experimental conditions were reported: Tm > 0 °C; 6.5 <= pH <= 7.5 and no denaturants. Experimentally determined structures were collected from the PDB and filtered according to method (x-ray diffraction) resolution (<= 3A) and percentage of missing residues (<5% compared to the Uniprot sequence). All protein structures were minimized using the standard NAMD algorithm and the CHARMM force field in vacuum
You can find more details in the Reference article