Thermometer 1.0: tutorial
Knowing the temperature at which proteins are stable has important theoretical implications that are intimately linked to properties of the native fold, and a wide range of potential applications from drug design to the optimization of enzyme activity. Here, we developed Thermometer, a tool based on a graph-theoretical framework able to assess thermal stability of a protein structure without any a priori information. In our approach, proteins are represented as energy-weighted graphs. Investigating the position of specific interactions within the native structure, we derived a parameter-free network descriptor that permits to distinguish thermostable and mesostable proteins with an accuracy of 76% and area under the receiver operating characteristic curve of 78%.
Our server can be found at this link
The main page appears as below.
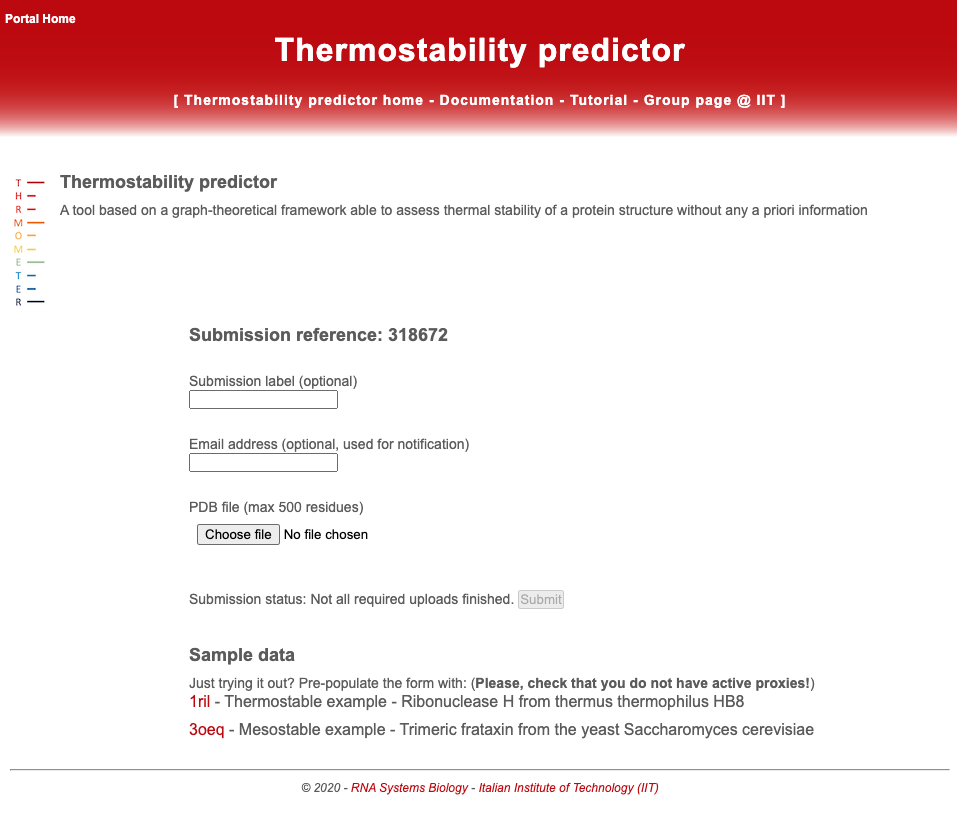
The user should upload a valid PDB file using the upload button. Due to running times, the size of the provided PDB structure must not exceed 500 residues. Optionally the user can choose a custom submission label and provide an email address to be notified on the job completion. The server automatically generates a unique reference number for the submission. By clicking the “Submit query” button, the job is submitted to the computation queue and the user can load the output page that is refreshed every 10 seconds. The user can bookmark the output page and check later the results.
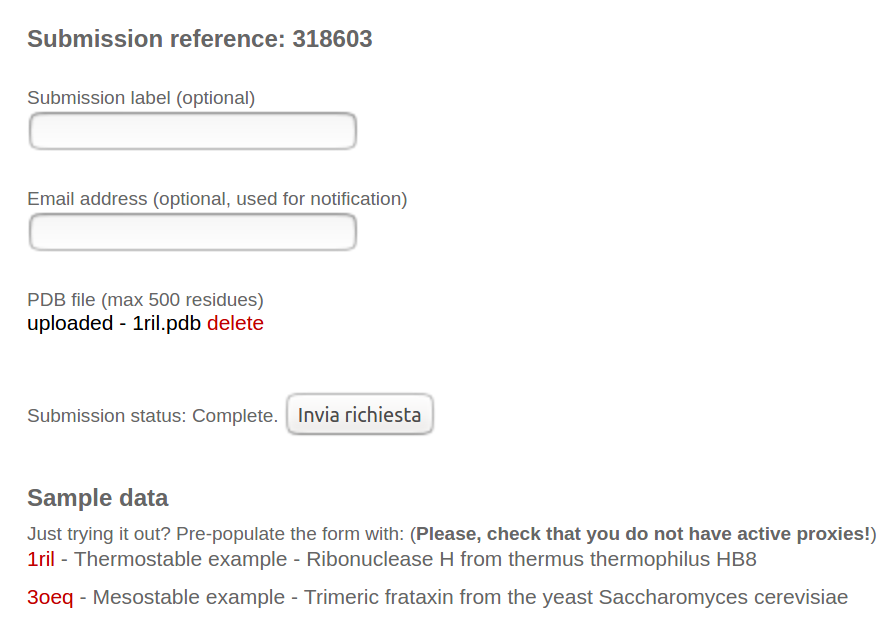
As sample data, we provided one case of a thermostable protein (PDB id: 1ril) and one mesostable (PDB id: 3oeq). By clicking on the PDB id (in red), the example is loaded in the input boxes. The user can optionally insert a valid email address to receive the results.
The output of Thermometer consists of:
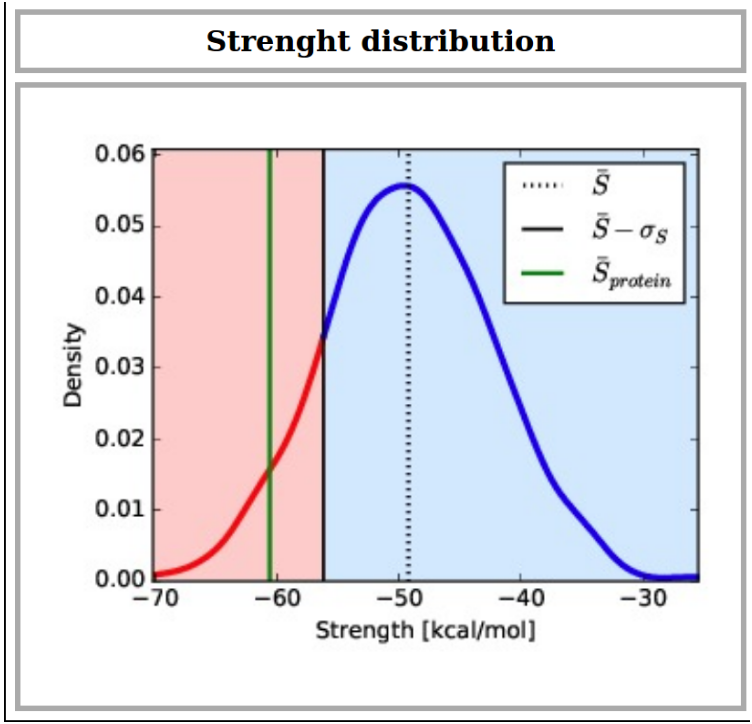
Strength distribution
The distribution of the mean Strength values associated with the 500 random networks which are generated using the submitted protein Residue Interaction Network (RIN) and sampling link weights (energies) from the mesostable total energy distributions. Black dotted line marks the value of the random mean Strength, while the black solid line indicates the mean less one standard deviation. Green line represents the mean Strength value of the real network, while red and blue regions in the random Strength distribution show the thermostable and mesostable propensity regions, respectively: if the real Strength lies in blue (resp. red) region the protein is expected to be more mesostable (resp. thermostable) since its mean Strength values is (is not) a typical mesostable value. Data of the real and random Strength values are provided in a zip file, which can be downloaded.
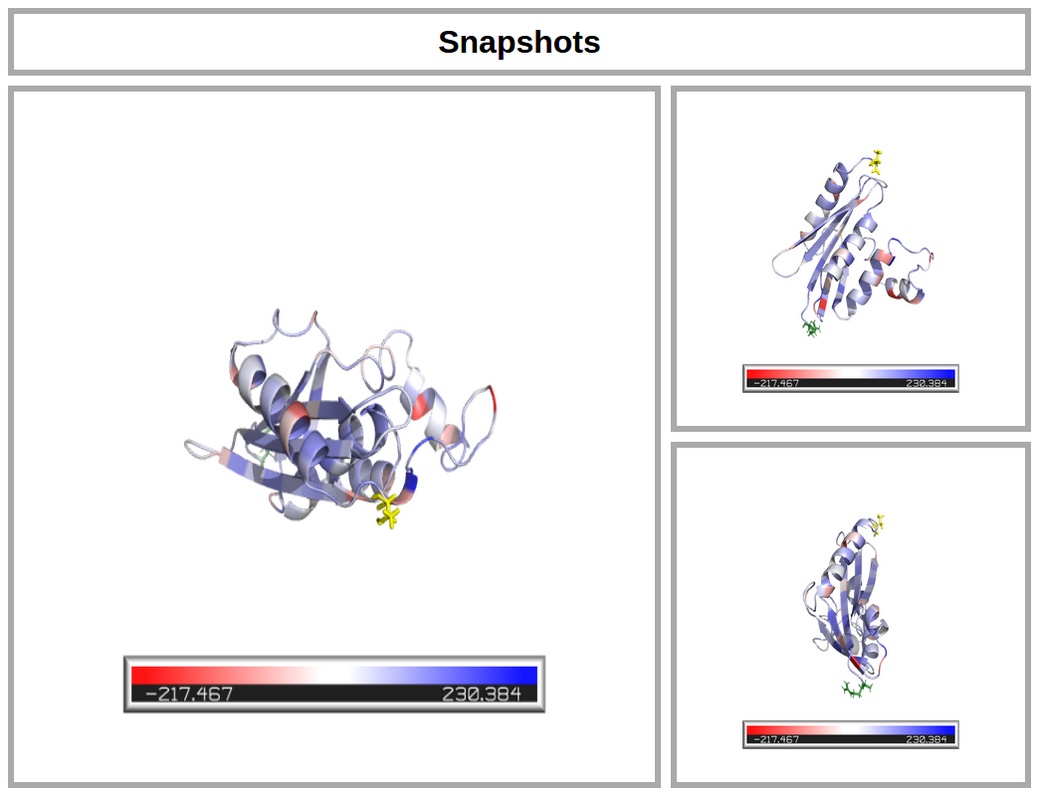
Protein visualization
Three ribbon and stick representations of the submitted protein with each residue of the protein colored according to the Single residue Tsi score (see Documentation). The score ranges from blue to red as the Tsi increases. The N-terminal residue of the protein is represented with green sticks, while the C-terminal residue in yellow ones. More information on the residues and the Tsi values are provided in the output 3 (see below). The two side snapshots are rotated with respect to the principal snapshot of 90 degrees around the x and z axes, respectively.
Single redisue Ts score
An interactive table with the values of the Tsi descriptor for each residue of the submitted protein. Colors span from blue to red as the descriptor increases. Above each cell, the specifics of the residue are reported, i.e. residue number, residue type (one letter amino-acid code) and protein chain. Displayed values are obtained using the total interaction energies as weights for the RIN links. The whole table with data for also only Coulombic energies and Lennard Jones ones is provided in the downloadable zip folder.

Clustering analysis
The results of the clustering analysis on the 84 proteins with experimentally known melting temperature and the submitted one are reported. For each protein, three different scores are used to cluster proteins, i.e the total energy and specific interaction terms of Coulomb and LJ interactions. On the left side, it is shown the hierarchical clustering using the Ward method as linkage function and the Euclidean distance among the three descriptors as distance metric. Proteins with Tm higher than 70 °C are colored in red, those with melting temperature lower than 70 °C are colored in blue, while the submitted protein is marked in green. On the right, the top 10 proteins of the original dataset, found closest to the submitted one in the simulative run, are reported. For each protein, one can find the PDB code, its distance from the submitted protein, the melting temperature and the three normalized Ts scores used for the clustering. The complete table is made available in the zip file that the user can download. Note that as the randomization procedure (see Documentation) is stochastic, some variability is present among different repetitions of the same run, which depends on the features of the associated RIN network.

Energy table
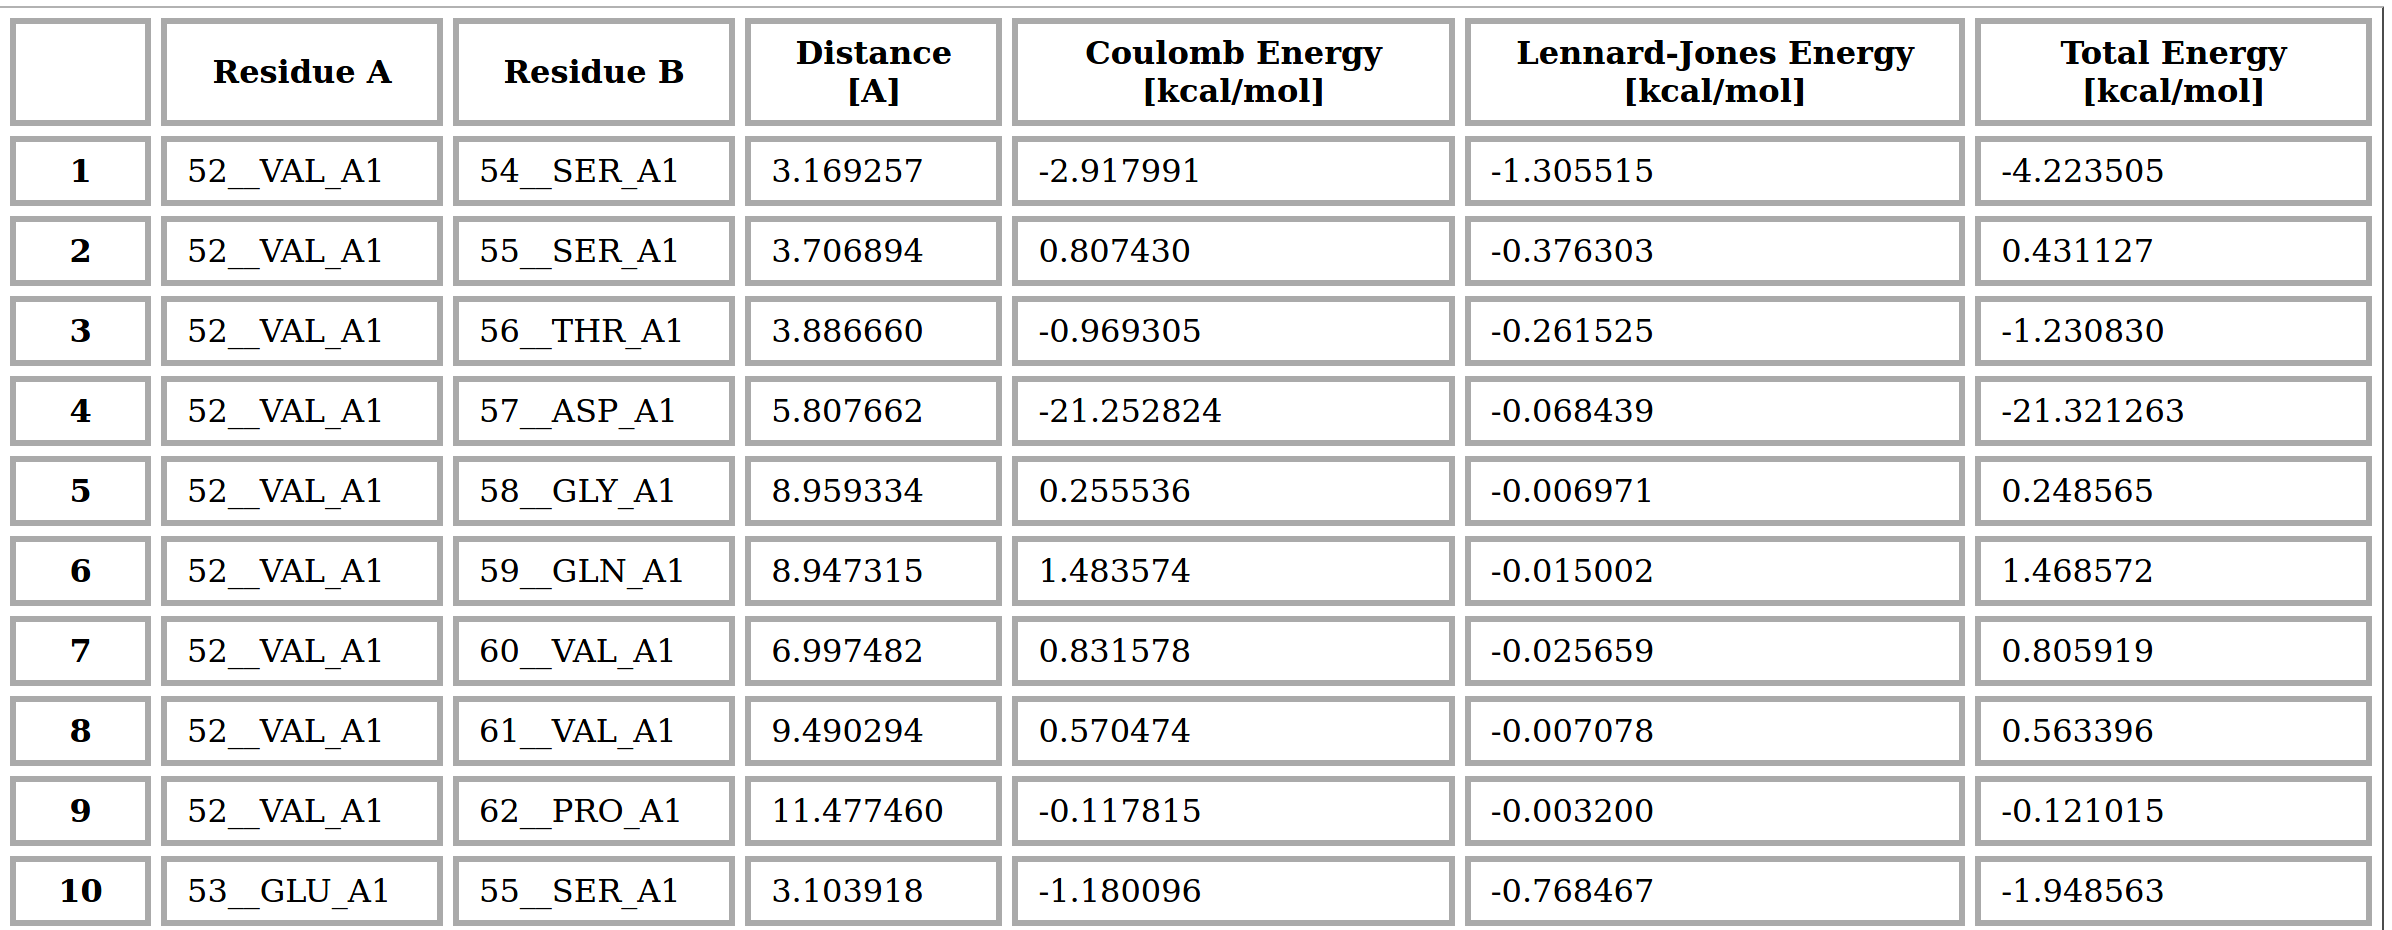
At the end of the output page, we reported the contact matrix of the RIN associate to the submitted protein in table format. In particular, each row of the table contains the key information about a couple of nodes (residues) found in contact. In particular, column ‘Residea A’ and ‘Residue B’ indicate the couple of residues, identified by the residue numbers, amino acid 3-letter code and chain. The ‘Distance’ column contains the distances (in Angstrom) between the two nearest atoms to the residues. Finally the last three columns report the values (in kcal/mol) of the interaction energies (network link weights) of Coulomb (C) , Lennard-Jones (LJ) and Total (C+LJ) between all the atoms of the considered residues. Only couples of nodes whose distance is smaller than 12 A are reported. The complete table is also provided in the output zip folder.
Running times
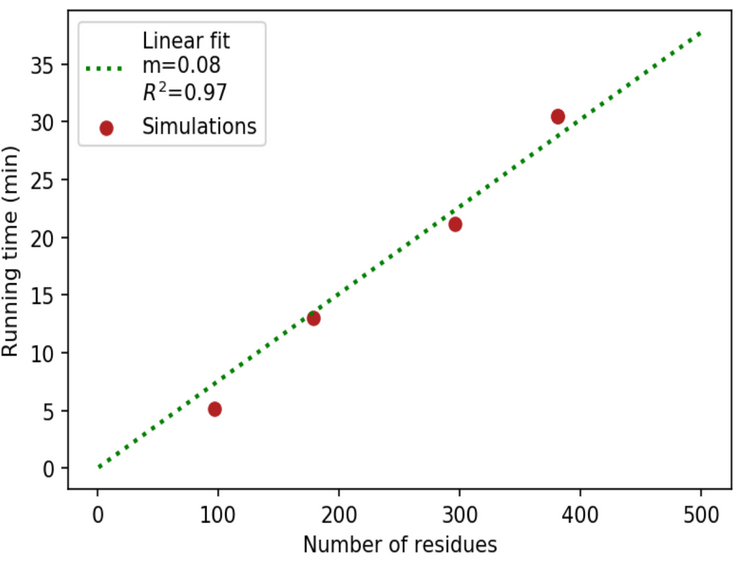
The average time to obtain the output depends on the size of the submitted protein in an approximately linear fashion.
|
||
| Residues | Expected time [min] | |
|---|---|---|
| 50 | ~4 | |
| 150 | ~11 | |
| 250 | ~18 | |
| 350 | ~25 | |
| 450 | ~30 | |
In particular, for a 50-residue-long protein, results are available to the user in about 4 minutes, while for a protein of average size (~250 resides) the waiting time is of nearly 20 minutes. As one can see from the plot of the running times vs protein length, the best linear fit has a slope of ~0.08. To avoid excessive waiting times we set a limit to the submitted proteins of 500 residues.
Energy table
At the end of the output page, we reported the contact matrix of the RIN associate to the submitted protein in table format. In particular, each row of the table contains the key information about a couple of nodes (residues) found in contact. In particular, column ‘Residea A’ and ‘Residue B’ indicate the couple of residues, identified by the residue numbers, amino acid 3-letter code and chain. The ‘Distance’ column contains the distances (in Angstrom) between the two nearest atoms to the residues. Finally the last three columns report the values (in kcal/mol) of the interaction energies (network link weights) of Coulomb (C) , Lennard-Jones (LJ) and Total (C+LJ) between all the atoms of the considered residues. Only couples of nodes whose distance is smaller than 12 A are reported. The complete table is also provided in the output zip folder.
System requirements
The Thermometer webserver requires the most recent version of the following browser with JavaScript enabled: Chrome, Firefox and Safari. Internet Explorer is not fully supported. If your browser connects through a proxy, please, be aware that you might experience a slow upload of the data in the query forms.